

XRP Faces Key Resistance as Profit-Taking Pressure Builds
XRP surged 11% on Thursday, breaking out from a bullish flag formation and briefly reigniting hopes for a sustained rally. However, despite the positive momentum, the token remains capped below a critical resistance level at $3.65, where a significant bearish reversal occurred in July.
That reversal took the shape of a tweezer top—a technical pattern consisting of two identical highs that reflect heavy selling pressure and a strong rejection zone. Until XRP clears this level with conviction, bulls may face stiff resistance on further upside attempts.
On-chain data signals caution. According to research from Alphractal, XRP’s Net Unrealized Profit/Loss (NUPL) has reached levels not seen since the market tops of 2018 and 2021—zones historically associated with elevated risk of distribution.
“Elevated NUPL values indicate many holders are sitting on significant unrealized gains,” said Alphractal. “This often precedes a wave of profit-taking that can stall or reverse uptrends.”
Key Technical Levels for XRP:
- Resistance: $3.38, $3.65, $4.00
- Support: $2.99, $2.72, $2.65
Bitcoin Forms Bullish Continuation Pattern Amid Calm
Bitcoin (BTC) is consolidating within a descending channel after last week’s pullback—often a bullish continuation pattern during broader uptrends. Price recently bounced off the 50-day Simple Moving Average (SMA), reinforcing the underlying bullish structure.
This technical setup—commonly referred to as a “bullish breather”—signals that BTC may be preparing for its next leg higher. A breakout from the channel would confirm strength and could open the door for a rally to new all-time highs above $123,000.
That said, a decisive move below the May high of $111,965 would suggest weakening momentum and could trigger a pullback toward the psychological $100,000 mark.
Key Technical Levels for BTC:
- Resistance: $120,000, $122,056, $123,181
- Support: $111,965, $104,562, $100,000
Ether Breaks Multi-Year Trendline, Targets All-Time High
Ether (ETH) has broken decisively above $4,200, marking a major technical breakout from a long-standing symmetrical triangle that had held the token in consolidation since its 2021 all-time high.
This breakout confirms a structural bullish reversal and suggests that ETH has entered a new long-term uptrend. With momentum accelerating, market participants are now watching for a potential run toward previous record highs and beyond.
If the current trend holds, ETH could soon test the $4,800–$5,000 range.
Key Technical Levels for ETH:
- Resistance: $4,400, $4,875, $5,000
- Support: $4,000, $3,941, $3,737


More Stories
XRP Jumps 8% as Heavy Holder Losses Hint at Improved Entry Levels
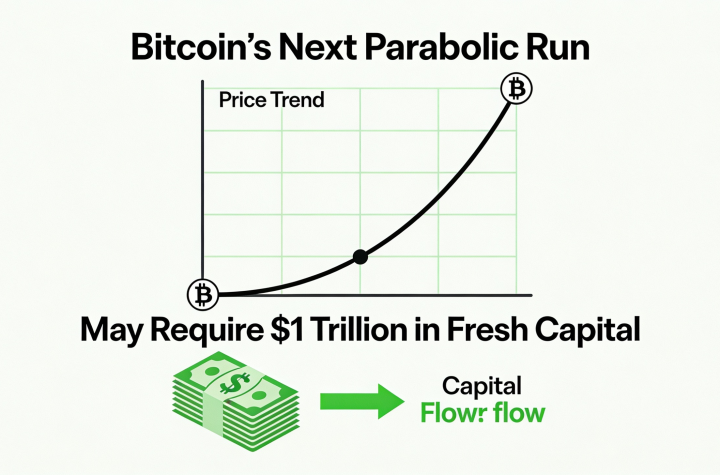
Bitcoin’s Next Breakout Could Require $1 Trillion in New Inflows
EU Targets Retail Access as Multibillion-Dollar Prediction Markets Surge