

Crypto Market Wavers as BTC/JPY Triangle Takes Focus; XRP, ETH, SOL Signal Technical Weakness
Fed Rate Cut Hopes Buoy Bitcoin Outlook, but Yen Strength and Technical Patterns Add Complexity
Traders are increasingly pricing in aggressive rate cuts from the U.S. Federal Reserve for 2026—a development that typically supports Bitcoin’s long-term bullish outlook. However, technical patterns in the BTC/JPY pair, alongside shifting macro conditions such as yen strength and falling bond yield spreads, suggest that risks remain in play for crypto bulls.
BTC/JPY Triangle Signals Uncertainty
While Bitcoin (BTC) continues to trade below the $120,000 mark in USD terms—hovering near key intraday moving averages—market analysts are turning their attention to the BTC/JPY pair on bitFlyer, where price action has carved out a descending triangle pattern at record highs.
The pattern, typically a bearish continuation signal, is defined by a series of lower highs against a horizontal support line—here marked around ¥17,160,000 (roughly $117,000). A break below that support would confirm bearish momentum and shift focus toward longer-term trendline support levels.
Still, a breakout above the upper boundary of the triangle could open the door to fresh all-time highs, especially as rate-cut expectations grow. According to futures data, traders are now pricing in 76 basis points of Fed easing in 2026—up from just 25 basis points back in April. This dovish pivot, coupled with firming long-end bond yields, suggests markets are expecting prolonged policy support.
Yen Strength Could Cap Crypto Gains
Despite the positive outlook for Bitcoin in USD terms, growing strength in the Japanese yen may pose headwinds for BTC/JPY. The spread between U.S. and Japanese 30-year government bond yields has narrowed to its lowest point since August 2022—traditionally a signal for yen appreciation.
A stronger yen could prompt risk-off flows and limit further upside in yen-denominated crypto assets.
AI Commentary: BTC/JPY remains range-bound within a descending triangle, raising near-term risk even as broader macro conditions turn more favorable. Yen strength, driven by narrowing bond spreads, could weigh on BTC/JPY and delay a bullish breakout.
Key BTC Levels
- Resistance: $120,000, $121,181
- Support: $116,000, $115,739, $111,965
XRP Breaks Key Support, Bearish Bias Deepens
XRP has shed more than 10% in the past 24 hours, in line with the bearish momentum flagged by technical charts earlier this week. The decline briefly found support at $2.99—coinciding with the 38.2% Fibonacci retracement of its rally from $1.90.
A partial recovery to $3.10 appears weak, as momentum indicators have shifted negative. The Guppy multiple moving average system is now bearish, and both price and trend signals have dropped below the Ichimoku cloud.
Failure to hold $2.99 could set the stage for a slide to $2.57, the 61.8% Fibonacci retracement. Bulls need a decisive push above $3.35 to challenge the prevailing downtrend.
AI Commentary: XRP has clearly broken down from its prior uptrend and trading range. The structure now favors continued weakness unless key resistance levels are reclaimed.
Key XRP Levels
- Resistance: $3.35, $3.65, $4.00
- Support: $2.99, $2.65, $2.57
ETH Slips Within Bearish Channel
Ethereum (ETH) continues to trend lower, printing a series of lower highs and lower lows on the hourly chart. The 50- and 100-hour SMAs have formed a bearish crossover, and the 200-hour SMA is losing its upward momentum. ETH has also dropped beneath the Ichimoku cloud, indicating growing downside risk.
The immediate trend remains bearish unless ETH can reclaim the $3,740 level. A break below the 200-hour SMA near $3,593 could lead to deeper losses.
AI Commentary: Technical signals suggest ETH is in a slow descent. Watch the 200-hour SMA as a key support; losing that could accelerate the decline.
Key ETH Levels
- Resistance: $3,740, $4,000, $4,109
- Support: $3,593, $3,480, $3,081
SOL Mirrors ETH With Similar Bearish Setup
Solana (SOL) is showing a pattern nearly identical to ETH’s, moving within a downward-sloping channel and now trading beneath the Ichimoku cloud. The Guppy trend indicator has flipped bearish as well.
SOL’s immediate bias remains negative unless the price can break back above $192—the most recent lower high. Short-term rallies may be capped by the channel’s upper resistance and underside of the cloud.
AI Commentary: As with ETH, SOL’s structure supports continued downside unless bulls reclaim control above $192. Bearish pressure remains intact.
Key SOL Levels
- Resistance: $192, $200, $218
- Support: $179 (daily low), $163 (200-day SMA), $145


More Stories
XRP Jumps 8% as Heavy Holder Losses Hint at Improved Entry Levels
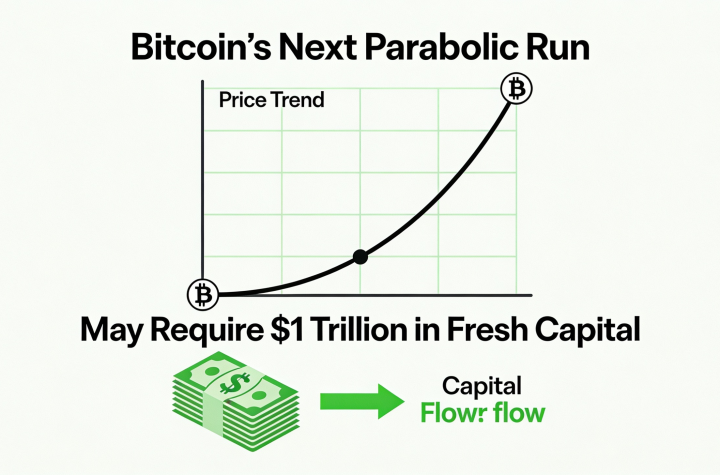
Bitcoin’s Next Breakout Could Require $1 Trillion in New Inflows
EU Targets Retail Access as Multibillion-Dollar Prediction Markets Surge