

XRP Rockets to All-Time Highs — Is 2017 Playing Out Again?
XRP has surged past $3.50 for the first time ever, igniting comparisons to its legendary 2017 bull run. The payments-focused token has gained over 580% since November after breaking out of a multi-year symmetrical triangle — a classic technical setup often preceding explosive moves.
This pattern is nearly identical to what played out in 2017, when XRP rallied thousands of percent in less than a year following a similar breakout. Back then, XRP soared from $0.00056 to $3.30 between March 2017 and January 2018. The symmetry between that cycle and today’s price action has traders and analysts wondering: is XRP rewriting history?
“History doesn’t repeat, but it often rhymes” — and XRP’s recent move is rhyming loudly with its past.
Short-Term Outlook: Cooling Phase Before Next Leg?
With the latest surge, XRP’s Bollinger Bands — a key volatility gauge — have expanded to levels not seen since December, suggesting a possible shift into consolidation.
Meanwhile, the MACD histogram is flashing early bearish signals on shorter timeframes, and the RSI has pulled back from overbought territory. These indicators typically suggest a pause or correction before a sustained rally resumes.
🧠 AI’s View: XRP’s volatility breakout may be followed by a consolidation range. Momentum has slowed on shorter timeframes, creating space for profit-taking before bulls attempt a fresh push.
- Immediate Resistance: All-time highs above $3.50
- Key Supports: $3.40, $3.00, $2.90
Bitcoin: Rejected at $120K, Support Eyes $112K
Bitcoin has been unable to hold above $120,000 this week, with three failed attempts marked by long upper wicks on the daily chart — a classic signal of buyer exhaustion. The 14-day RSI has also rolled over from overbought territory, while price continues to chop around key moving averages.
Unless fresh momentum returns, BTC may revisit the former record high of $111,965 for support.
🧠 AI’s View: Bitcoin is in reset mode after repeated failures at $120K. A healthy pullback toward support could set the stage for another breakout.
- Resistance Levels: $123,181, $130,000, $140,000
- Support Levels: $117,500, $115,740, $111,965
Ethereum: Poised to Outrun Bitcoin
Ether is flashing mixed short-term signals. While the hourly chart shows a bearish RSI divergence, broader trend indicators remain firmly bullish. The ETH/BTC pair is closing in on a golden cross — a long-term bullish crossover between the 50- and 200-day SMAs.
With ETH’s short-term pullbacks holding above key averages, analysts expect a continuation higher.
🧠 AI’s View: ETH remains technically strong. Even if price dips, the structure favors a move toward $4,000 as long as support holds.
- Support Levels: $3,420, $3,083, $3,000
- Resistance Levels: $4,000, $4,100, $4,300
Solana: Breakout or Pullback Looming?
Solana (SOL) is consolidating below the $185–$187 resistance zone — last visited in May — but momentum remains strong. The Guppy indicator has flipped bullish, and prices are holding above the Ichimoku cloud, pointing to a bullish bias.
That said, traders should keep an eye on the hourly chart: a drop below the cloud could increase the risk of a short-term correction.
🧠 AI’s View: A breakout to $200 is in sight, but a dip below the Ichimoku cloud would change the outlook quickly.
- Support Levels: $168, $157, $145
- Resistance Levels: $187, $200, $218


More Stories
XRP Jumps 8% as Heavy Holder Losses Hint at Improved Entry Levels
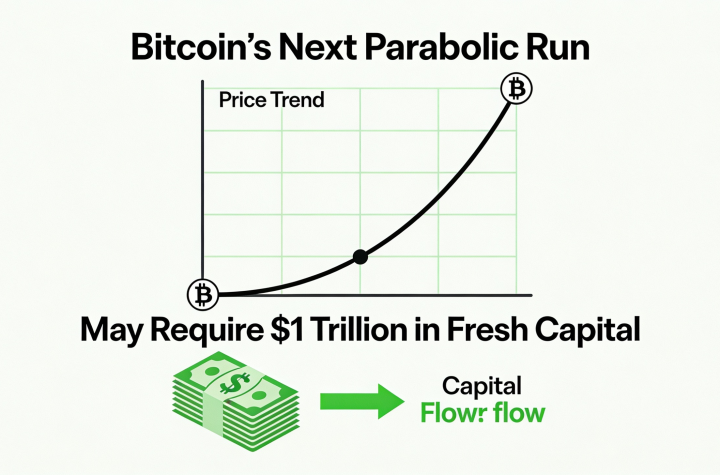
Bitcoin’s Next Breakout Could Require $1 Trillion in New Inflows
EU Targets Retail Access as Multibillion-Dollar Prediction Markets Surge