

Bitcoin Could Rally Toward $140K as BlackRock’s IBIT ETF Confirms Bullish Breakout
Bitcoin (BTC) is showing renewed strength, breaking above $111,000 and flashing signals that could point to a 30% rally, according to chart analysis tied to BlackRock’s spot bitcoin ETF (IBIT).
IBIT, which closely tracks BTC’s spot price, has broken out of a bullish flag formation on its daily chart — a classic technical pattern signaling continuation of an uptrend. The breakout follows more than a month of sideways consolidation that began in May.
On Wednesday, IBIT rose 2.85%, briefly surpassing its May peak of $63.70, reinforcing the breakout structure spotted earlier this month. Analysts now suggest that the ETF — and by extension, bitcoin — could see strong upside follow-through.
Technical Target: $140K in Sight
Bull flag patterns often precede sharp price moves, with targets derived from the size of the prior rally. In this case, the measured move projects a 30% upside, which could push BTC well above $140,000 in the coming weeks.
While technical indicators favor further gains, analysts note that macro risks remain. A shift in investor sentiment or broader market turbulence could invalidate the pattern and send prices back into consolidation.
Still, broader momentum remains bullish. Veteran trader Peter Brandt recently pointed to a similar chart setup, suggesting BTC could surge to $134,000 if current levels hold and volume builds.


More Stories
XRP Jumps 8% as Heavy Holder Losses Hint at Improved Entry Levels
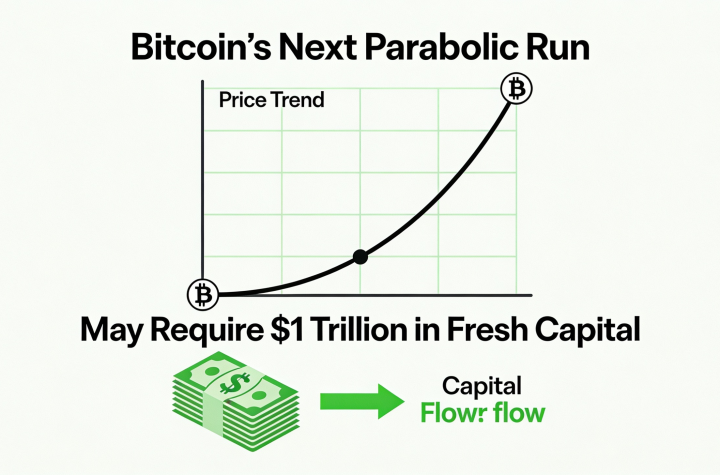
Bitcoin’s Next Breakout Could Require $1 Trillion in New Inflows
EU Targets Retail Access as Multibillion-Dollar Prediction Markets Surge