
Bitcoin’s underlying demand continues to weaken, even as institutional accumulation accelerates. Fresh data from CryptoQuant shows net demand contracting by roughly 63,000 BTC per month, while large holders have distributed close to 188,000 BTC over the past year.
The imbalance is becoming more pronounced: the biggest buyers in the market are active, but they are not keeping pace with broader selling pressure.
CryptoQuant’s weekly report puts 30-day apparent demand at -63,000 BTC as of late March. Over the same period, spot Bitcoin ETFs absorbed around 50,000 BTC—the strongest inflows since October 2025—while Strategy added another 44,000 BTC. Combined, these two institutional channels purchased approximately 94,000 BTC in March.
Even so, overall demand remains negative, implying that other market participants—including retail investors, miners, funds, and long-term holders—sold an estimated 157,000 BTC during the same window.
Several additional indicators point to the same structural weakness.
Large holders, defined as wallets with 1,000 to 10,000 BTC, have shifted sharply from accumulation to distribution. Once a key source of buying pressure, they are now among the market’s largest sellers. Over the past 18 months, their positioning has swung from adding roughly 200,000 BTC to offloading 188,000 BTC—a near 400,000 BTC reversal that ranks among the most aggressive distribution cycles on record.
Mid-sized holders (100 to 1,000 BTC) are still accumulating, but at a much slower pace. Annual inflows have dropped more than 60% since October 2025, falling from nearly 1 million BTC to 429,000. The demand is still there, but it has weakened significantly.
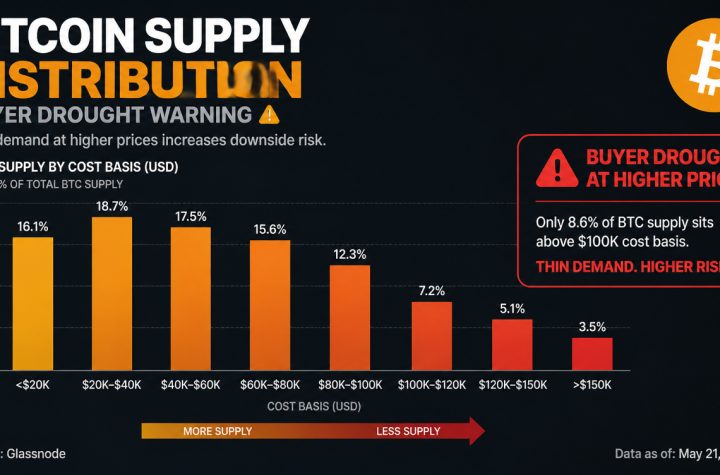
At current levels between $67,000 and $68,000, Bitcoin trades about 21% above its realized price of $54,286, the average cost basis across the network. Historically, cycle bottoms tend to form only after prices fall below this level.
That dynamic was evident in 2022, when Bitcoin traded under its realized price for several months and ultimately bottomed near $15,500—around 15% below the metric.
Today’s market has not reached that stage, though the gap is narrowing quickly. At its late-2024 peak above $119,000, Bitcoin traded at a premium of roughly 120% to realized price. That premium has since compressed to just 21% in about 15 months, marking one of the fastest contractions outside of outright crash conditions.
Sentiment remains deeply negative. The Fear and Greed Index has hovered between 8 and 14 for weeks, firmly in extreme fear territory. At the same time, Bitcoin ETFs recorded more than $1 billion in net inflows in March.
This divergence highlights a key feature of the current market: institutional buying is not translating into broader confidence. Instead, large players are stepping in while other participants continue to exit or stay sidelined.
The Coinbase Premium Index reflects a similar trend. Often used as a proxy for U.S. demand, it has remained consistently negative since Bitcoin’s all-time high above $126,000 in October 2025. Even at lower price levels, U.S. investors have yet to return in meaningful size.
Recent price action reinforces this cautious behavior. Over the past five weeks, Bitcoin has traded within a narrow $65,000 to $73,000 range, reacting to headlines tied to the Iran conflict. Escalation news has triggered sell-offs, while de-escalation has sparked short-lived rallies—leaving the market largely unchanged.
This repetitive pattern has reduced conviction. Rather than triggering panic selling, it has led to gradual disengagement, with many participants choosing not to take positions at all—a trend reflected in weakening demand data.
Despite these pressures, Bitcoin’s current drawdown—around 47% from its October peak—remains significantly less severe than the 80%+ declines seen in previous cycles. Analysts increasingly view this as evidence of a maturing market structure.
Fidelity Digital Assets analyst Zack Wainwright recently described Bitcoin’s price action as becoming “less impulsive,” with a lower likelihood of extreme downside events. Similarly, AdLunam co-founder Jason Fernandes noted that drawdowns compressing toward 50% reflect deeper liquidity and rising institutional participation, both of which reduce volatility.
This shift could also change how the current cycle plays out. If Bitcoin is evolving into an asset with shallower corrections, the ongoing demand contraction may not resolve through the kind of sharp capitulation that marked previous market bottoms.
Looking ahead, two potential catalysts could influence demand.
Morgan Stanley has launched a low-fee Bitcoin ETF with a 14-basis-point expense ratio, opening access to 16,000 financial advisors overseeing $6.2 trillion in assets—introducing a new channel for capital inflows.
Meanwhile, Strategy’s STRC preferred equity offering continues to attract funding, supporting its ongoing accumulation of roughly 44,000 BTC per month. If sustained, this could provide a steady source of demand, though it remains concentrated in a single entity.
In the near term, CryptoQuant sees potential for a rebound toward the $71,500 to $81,200 range if geopolitical tensions ease. These levels align with key on-chain resistance zones tied to trader cost bases, which have historically capped rallies during bearish phases.
The broader takeaway across multiple indicators is consistent: Bitcoin’s demand structure is weakening internally.
This does not necessarily mean the current price range will break. However, it suggests that market stability is increasingly dependent on whether institutional buyers—ETFs, Strategy, and new entrants like Morgan Stanley—can continue absorbing the steady supply being offloaded by the rest of the market.
More Stories
According to CryptoQuant, Bitcoin’s rising holder supply is concealing a lack of new buyers
A 45% flash crash in Hyperliquid’s SpaceX pre-IPO contracts wipes out $1.5 million in positions
BTC holds under $73,000 even as U.S.–Iran peace deal speculation builds