

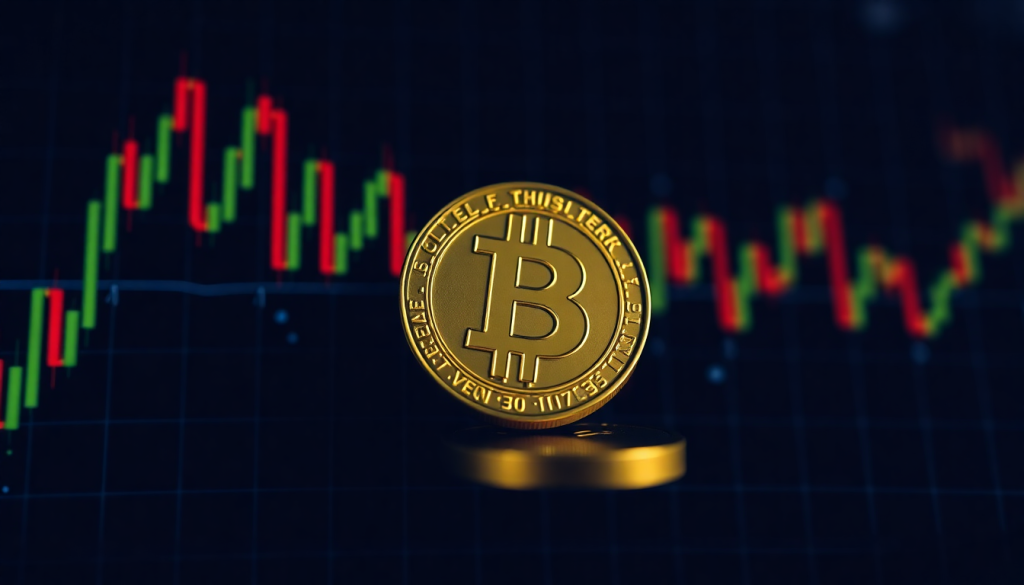
Oil prices are approaching a critical turning point that could influence inflation, interest rates and the direction of risk assets, including Bitcoin and technology stocks. Traders are closely watching West Texas Intermediate (WTI) crude oil, the main U.S. benchmark, as its price chart signals the possibility of a significant move.
Bitcoin traders and participants across financial markets should monitor WTI crude because its price is nearing an important inflection point. The next breakout could have far-reaching consequences for inflation expectations and investor appetite for risk.
The daily WTI chart resembles a sideways funnel, with the wide price fluctuations seen in March and April gradually narrowing. Successive peaks have declined, while price dips have become less pronounced, bringing the market toward a tighter range near $102.
Technical analysts describe this formation as a coil or pennant pattern. As price movements become increasingly compressed, the market resembles a spring building pressure before a potential breakout. When the pattern resolves, it can produce a substantial move, according to Naomi Blohm, senior market advisor at agricultural advisory firm Total Farm Marketing, who discussed the setup on X.
This is a common interpretation of contracting triangle patterns among technical traders. However, the formation does not indicate whether the eventual breakout will be bullish or bearish, leaving two possible outcomes.
Two Possible Directions for Oil Prices
If WTI breaks above the upper boundary of the pattern, currently around $105.50, traders could turn their attention to the March and April highs between $117 and $119.
A sustained rise in oil prices could create further inflationary pressure, push government bond yields higher and encourage central banks to maintain elevated interest rates for longer. Tighter financial conditions could weigh on borrowing and investment, reducing demand for risk-sensitive assets such as Bitcoin and technology stocks. Oil prices have already climbed approximately 80% this year, adding to inflation concerns.
Although Bitcoin is frequently described as digital gold, its market behavior has often more closely resembled equities. CoinDesk’s analysis of TradingView data puts Bitcoin’s 30-day correlation with the Nasdaq 100 at 0.64. A correlation of 1 indicates that two assets move in the same direction in lockstep.
Bitcoin has also moved inversely to oil since the Iran war began. Its 30-day correlation with crude oil has shifted to minus 0.47, compared with a positive 0.18 immediately before the conflict. If rising oil prices and bond yields put pressure on equities, Bitcoin could face similar headwinds.
The alternative scenario involves a downward breakout. Traders are watching the $93 level as a potential threshold for a move lower.
A decline in oil prices could ease concerns about inflation and reduce pressure on bond yields and interest rates. Such a development could improve sentiment toward equities and cryptocurrencies by supporting expectations of less restrictive financial conditions.
Oil Breakout Could Set the Tone for Risk Assets
The direction of the next major move in crude oil remains uncertain. Nevertheless, the breakout could help determine how investors position themselves across financial markets in the coming weeks.
Iran, a major oil exporter that has been at war with the United States since March, is also preparing for the possibility of higher prices. According to reports, Iranian budget planners are considering an oil price of $130 per barrel for the coming year.
For Bitcoin traders, WTI crude is therefore an important market indicator to watch. A move toward the $117–$119 range could intensify inflation concerns and pressure risk assets, while a decline toward $93 could offer relief to stocks and cryptocurrencies.
About The Author



More Stories
Bitcoin Slides to $80K as Fed Dissent and Tech Earnings Rattle Markets
NYSE Parent Explores Bringing Hyperliquid Perpetual Futures to U.S. Markets
ARK Invest Snaps Up Robinhood Shares After 23% Drop in Biggest Buy in Six Months