

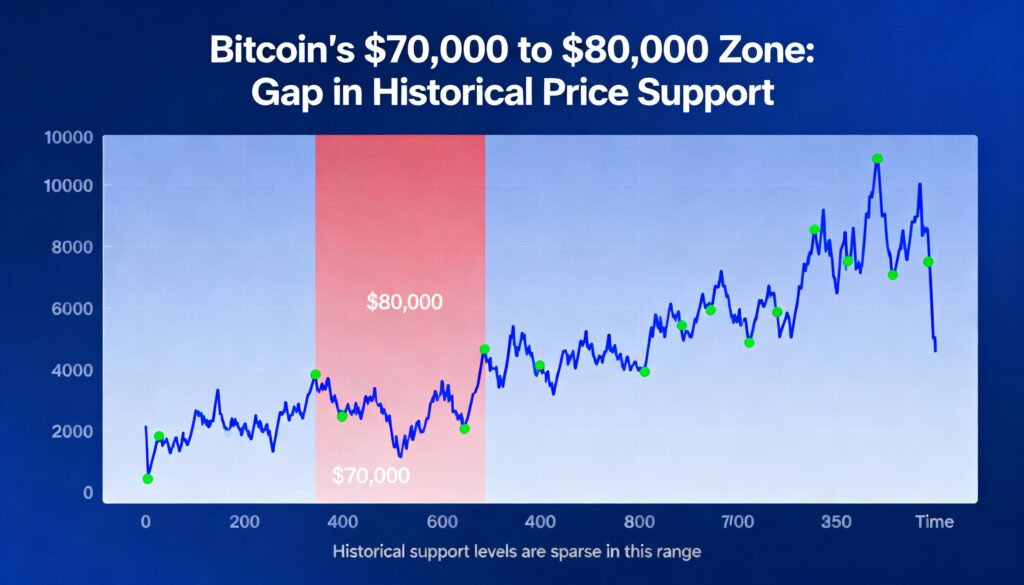
Five years of CME futures data highlight where bitcoin has—and hasn’t—established meaningful price support.
Examining bitcoin (BTC $87,913.36) futures trading over the past five years shows where price has spent the most time consolidating, offering insight into stronger and weaker support zones. One way to gauge this is by counting the number of trading days within specific price bands. Longer consolidation periods typically indicate that positions have been built, creating more robust support.
Data from Investing.com reveals stark contrasts. Excluding brief periods above $120,000, BTC has spent only 28 days in the $70,000–$79,999 range and 49 days between $80,000–$89,999. By contrast, lower ranges such as $30,000–$39,999 and $40,000–$49,999 saw nearly 200 trading days, reflecting much more extensive testing and consolidation.
Throughout December, bitcoin has traded in the $80,000–$90,000 range after its October peak, revisiting an area where historical activity—and support—is limited compared with 2024’s significant consolidation between $50,000 and $70,000. This uneven distribution suggests weaker support in the $80,000s and particularly between $70,000 and $79,999.
Glassnode’s UTXO Realized Price Distribution (URPD) confirms the scarcity of supply in the $70,000–$80,000 zone, reinforcing the futures data. Together, the datasets suggest that if bitcoin undergoes another corrective phase, the $70,000–$80,000 range could act as a key area where price may need to consolidate to establish stronger support.
About The Author





More Stories
U.S. Adds Just 29,000 Jobs in September as Unemployment Rate Hits 4.2%
Bitcoin Dominance Nears 60% as Crypto Traders Shift Into Risk-On Mode
Bitcoin Open Interest Surges $2.3B as Traders Increase Bullish Bets