

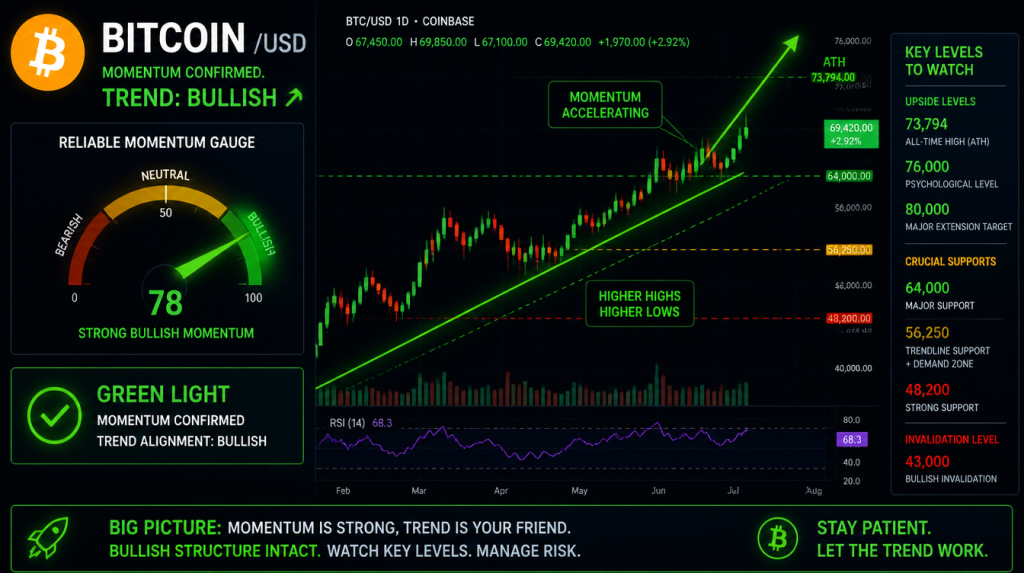
Bitcoin’s longer-term MACD indicator has turned bullish, signaling improving momentum and raising the possibility of further gains. However, traders are watching several major resistance levels that will determine whether the current recovery develops into a stronger uptrend.
Bitcoin has gained nearly 10% this month and could continue climbing toward the $70,000 range, a level that has repeatedly limited upside moves in recent months.
The signal comes from the moving average convergence divergence (MACD) histogram, a widely followed technical tool that measures trend direction and momentum by moving around a central zero line. A move above zero generally indicates strengthening bullish momentum, while a move below zero suggests weakening conditions.
The traditional MACD setup uses 12-day and 26-day moving averages combined with a 9-day signal line. However, these shorter settings can often create false signals and frequent reversals. To reduce market noise, many traders use longer-term configurations, such as the 50-day, 100-day, and 9-day combination.
This slower MACD histogram has now moved above the zero line, marking a shift toward positive long-term momentum. In practical terms, the indicator suggests bitcoin’s recent recovery may have further room to run rather than quickly losing steam. BTC was trading slightly above $64,000 at the time of writing.
Although traders rarely depend on a single technical indicator, this longer-term MACD has historically provided useful signals during major market moves. Since bitcoin’s decline from its record high near $126,000, negative MACD crossovers have often appeared before deeper sell-offs, while bullish crossovers have been followed by strong recovery phases, including the December–January and February–May rebounds.
The latest bullish crossover points to a potential continuation of the recovery, but it does not automatically confirm the beginning of a new major bull market. Additional confirmation will be needed, with key resistance levels now becoming critical.
Key Bitcoin Levels to Watch
50-day moving average: Around $65,434
The first major hurdle is bitcoin’s 50-day simple moving average, which represents the average price over roughly the past two months. Traders across crypto and traditional markets often use this level as a measure of short-term trend strength. A decisive move above it could indicate that bullish momentum is gaining traction.
$67,292 resistance zone
The next important level is the mid-June peak of $67,292. Bitcoin briefly recovered from early June lows near $60,000 before sellers stepped in and pushed prices lower. Breaking above this resistance would signal that buyers have successfully overcome a previous supply zone.
200-day moving average: Around $71,147
The most significant technical barrier is the 200-day moving average, one of the market’s most closely watched long-term trend indicators. This level previously rejected bitcoin’s recovery attempt in early May after the rebound from February lows near $60,000. A strong breakout above this area would provide stronger evidence that bitcoin is entering a broader bullish phase.
Until BTC clears these resistance levels, traders may remain optimistic but cautious.
$80,000 Options Level Could Add Volatility
Another area traders are monitoring is the $80,000 strike price in Deribit’s bitcoin options market. The level holds more than $1.21 billion in open interest, representing the largest concentration of options exposure on the platform.
If bitcoin approaches this zone, activity from traders managing those positions could increase volatility across spot and futures markets, potentially creating sharper price movements.
About The Author





More Stories
CFTC Warns Prediction Platforms of Manipulation Risks in ‘Mention Markets’
Lummis Says Trump Opposition Helped Derail Crypto Clarity Act
XRP Ledger Retries Upgrade Designed to Split Payments and Compliance Roles