

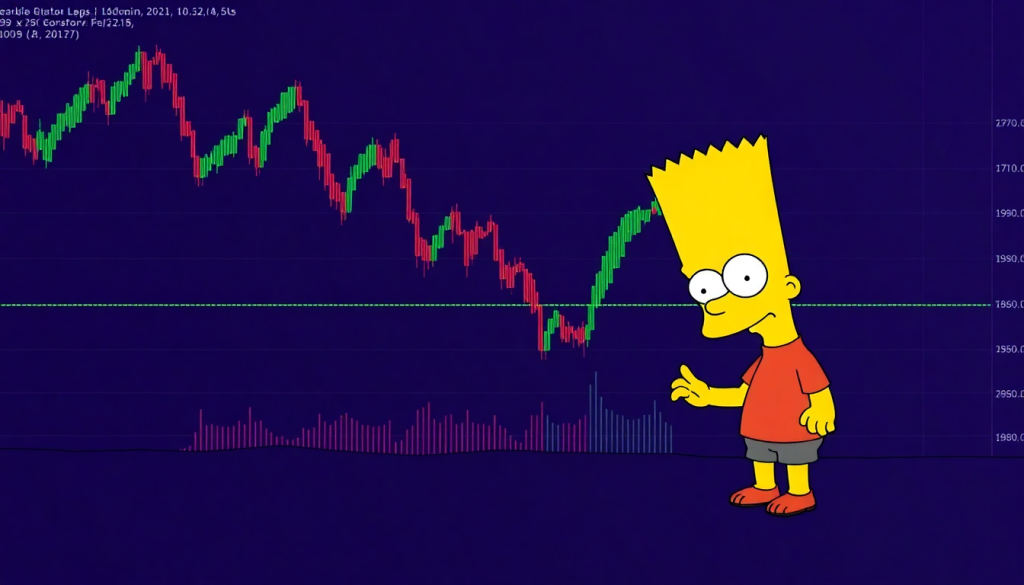
Analysts are once again turning to a cartoon-inspired term to describe the recent weakness across major cryptocurrencies.
The “Bart Simpson” pattern is making a comeback in crypto discussions, with traders using the name of the spiky-haired character from The Simpsons to describe the latest market moves.
Bitcoin (BTC), XRP and ether (ETH), among other major tokens, have retreated after posting sharp gains. The resulting chart formation resembles Bart’s distinctive hairstyle: a rapid move higher followed by a period of sideways trading and then a steep decline. The bitcoin version of the pattern was first coined in 2015 by former X user @whaleclubco, when BTC was trading at $229, and has not been widely discussed for at least three years.
Traders began pointing out the formation on Sept. 1, sparking fresh debate across crypto X. Ben Cowen, founder of Into the Cryptoverse and a market analyst, told his 1.2 million X followers that bitcoin appeared to be developing the pattern.
The setup consists of three stages. The first, known as the Spike, is a rapid and forceful move either higher or lower that can encourage traders to chase momentum. That is followed by the Flat Range, or “head,” during which the asset trades within a relatively narrow range and volume generally declines. The final stage is the Snap Back, a swift reversal that takes prices in the opposite direction of the initial move. Together, the three stages can create the outline of Bart Simpson on a price chart.
For bitcoin, the initial Spike started Aug. 19, when BTC was around $64,420. By Aug. 21, it had climbed nearly $14,000 to about $78,300 before encountering resistance below $80,700 on Aug. 25. At the time of writing, bitcoin was trading near $76,500, according to CoinDesk data.
On a chart, the sequence closely resembles the familiar Bart Simpson formation, with the market now moving through what could be the final Snap Back phase.
Crypto traders remain divided over whether the pattern will fully develop. Some believe bitcoin can resume its broader advance, while others see any deeper decline as a potential opportunity to accumulate ahead of another bullish move.
Mati Greenspan, founder of Quantum Economics and a former senior analyst at eToro, said a genuine Bart Simpson formation would require bitcoin to fall at least 20%. Even so, he said he does not expect that outcome.
Greenspan noted that a 20% decline would be necessary before the setup could properly be classified as a Bart Simpson pattern, adding that such formations were once more common when bitcoin traded in thinner and less mature markets.
He said he had not seen a particularly clean example in years, although the pattern remains possible. Greater liquidity, deeper markets and increased institutional participation have, in his view, made these formations much less common in bitcoin’s normal price behavior.
The pattern can appear in assets beyond bitcoin, Greenspan said, with XRP presenting a different situation.
XRP’s sharp climb from approximately $1 to $1.70 provides the ingredients for a similar setup. Greenspan said that if the token were to retrace aggressively toward the starting point of the rally, its decline could resemble the kind of correction associated with the pattern.
XRP’s Spike also began on Aug. 19. The token surged from roughly $1 to $1.52 by Aug. 22. It then entered the Flat Range portion of the formation, although the range has gradually tilted lower, with XRP trading near $1.32 at the time of writing.
Frank Hepworth, CEO and founder of New Market Trading, sees the current chart structure as a significant warning. He described the Bart Simpson formation as a classic distribution setup in which larger holders sell into buying from retail traders.
Hepworth said bitcoin’s “Bart’s hair” developed as the cryptocurrency repeatedly encountered resistance around its 50-week moving average near $81,000. He considers that level the “last line in the sand” for bearish traders.
Bitcoin’s inability to break above that resistance leaves the market vulnerable to a decline toward $70,000, according to Hepworth, with a deeper sell-off potentially taking BTC to $58,000. The risk has led his firm to reduce its market exposure.
Hepworth also sees greater downside risk for XRP because the token has been losing strength relative to bitcoin.
The XRP/BTC pair has fallen back below its 20-week moving average, which Hepworth believes could leave XRP lagging bitcoin during a broader market correction. If BTC retreats toward $70,000, he estimates XRP could fall into a range between $0.55 and $1.21. Should bitcoin slide further to $58,000, XRP could decline as low as $0.46.
About The Author




More Stories
Franklin Templeton added approximately $150 million in tokenized money market fund shares to the XRP Ledger on Friday, with all newly issued tokens sent to a single wallet. Two subscription transactions recorded on Thursday nearly quadrupled the fund’s token supply on the network.
Apex Group CEO Warns U.S. Clarity Act Delay Could Boost Asia and Middle East
a16z Rebrands Crypto Fund as a16z Frontier to Expand Its Investment Focus