
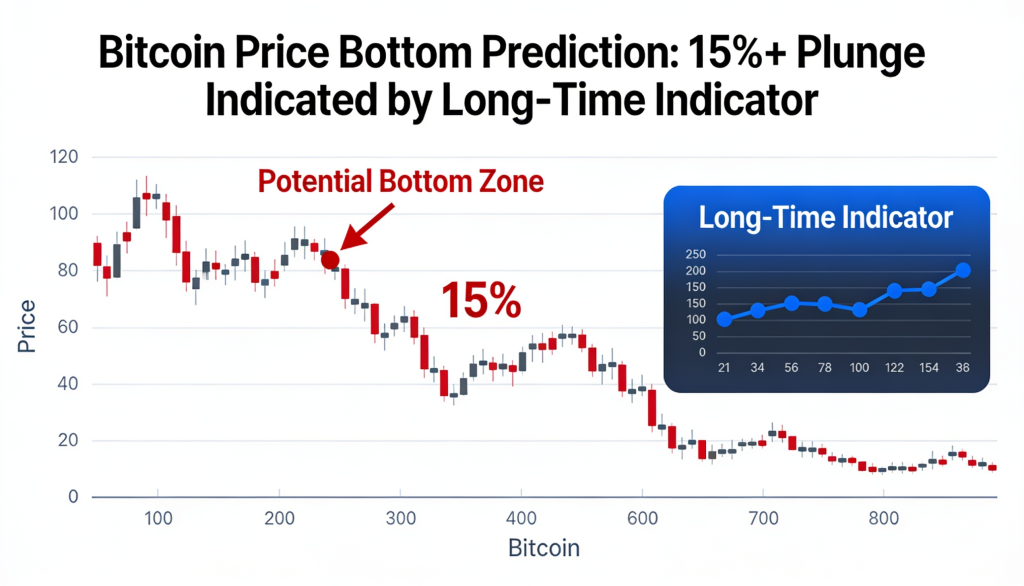
As Bitcoin tests its 200-week moving average, on-chain data suggests the $50,000–$54,000 zone could become the next major area of price contention.
With BTC trading close to its 200-week moving average—currently near $62,400—market participants are closely assessing whether this long-term support level can hold. If it breaks, attention is expected to shift toward Bitcoin’s realized price, around $53,457, which has historically acted as a final support zone during deep bear markets.
Realized price reflects the average on-chain cost basis of all circulating Bitcoin and has often served as a key downside anchor in prior market cycles.
Across previous bear markets—including 2011, 2015, 2018–2019, the March 2020 crash, and 2022—Bitcoin typically traded near or slightly below its realized price before forming a cycle bottom. In the current cycle, price has not yet fallen below that level.
From a behavioral standpoint, capitulation tends to occur when market prices slip under investors’ average entry costs, triggering realized losses, panic selling, and heightened bearish sentiment. With realized price clustered near $54,000, a move below that threshold could significantly increase market stress.
Breaking down realized price by investor cohort adds further context. Large holders with 10,000–100,000 BTC have an estimated cost basis around $54,300, while the largest whales holding over 100,000 BTC sit closer to $49,000. If these groups defend their aggregate entry levels, a potential bottom could form within the $50,000–$54,000 range.
Meanwhile, smaller retail holders with less than 1 BTC have a realized price below $48,000, meaning they would likely remain in profit even during a deeper correction.
Historically, Bitcoin has tended to establish durable bear-market lows only after briefly trading below its aggregate realized price.


More Stories
Standard Chartered Sees Aave Rallying to $3,500 by 2030 on DeFi Resurgence
Bitcoin Holds Near $62,500 as Bearish Pressure Intensifies Across Crypto Markets
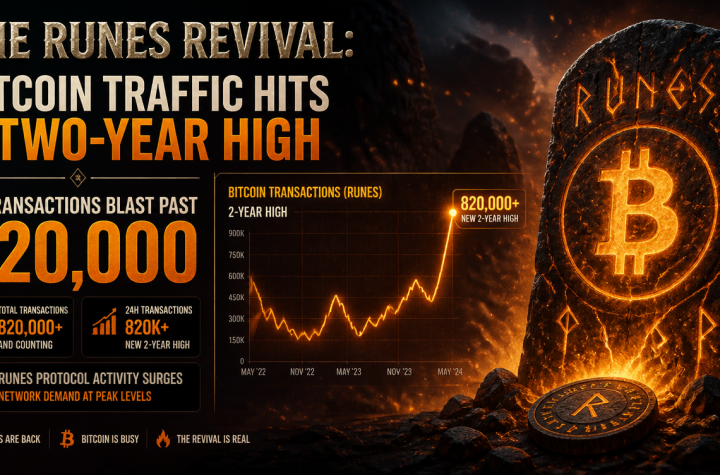
Runes Comeback: Bitcoin Activity Surges to Two-Year High as Transactions Top 820,000