

Bitcoin (BTC) could be on the verge of a major price movement as a key technical indicator suggests that volatility is about to rise. The Bollinger bandwidth, which measures the distance between the upper and lower Bollinger bands, has dropped to under 10%, a level last observed right before Bitcoin’s explosive rally in November.
Bollinger bands are calculated using the 20-day moving average of an asset’s price, with the bands set two standard deviations above and below the average. The Bollinger bandwidth shows the spread between the two bands, and when it narrows, it typically signals a period of low volatility, followed by a sharp increase in market movements.
When the Bollinger bandwidth has dipped below 10% in the past, it has often been followed by significant price action. For example, in November, as the bandwidth tightened, Bitcoin soared from $70,000 to $100,000 in a matter of weeks. On the other hand, in June, when the bandwidth contracted, Bitcoin fell from $69,000 to $54,000 in three weeks.
Currently, Bitcoin is trading between the two Bollinger bands, making it unclear which direction the market will move. Traders are watching closely for a breakout above the upper band, which would signal bullish momentum, or a drop below the lower band, which could suggest a bearish trend. As the market prepares for increased volatility, many traders are positioning themselves to take advantage of potential price swings.


More Stories
Nasdaq Pushes Market Data Onto Blockchain Rails in Distribution Expansion
Bitcoin’s Tight $59K–$60K Range Raises Risk of Sharp Breakdown
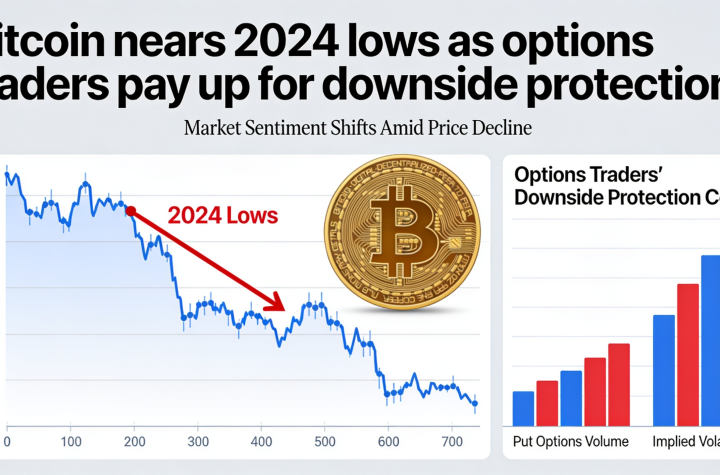
Bitcoin Slides Toward 2024 Lows as Traders Rush for Downside Hedges