
A roughly 50% slide from recent highs has pushed bitcoin into a zone historically associated with extreme pessimism, reigniting debate among crypto analysts.
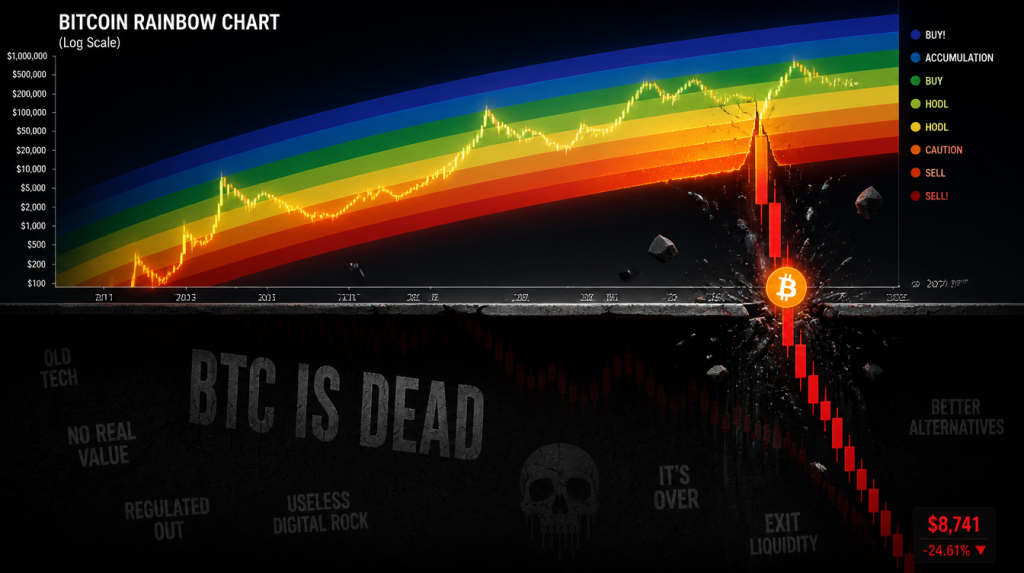
Bitcoin has dropped below the lowest band of the widely followed Rainbow Chart for only the second time ever. The model, created more than a decade ago, tracks BTC’s long-term price cycles using a logarithmic growth curve and color-coded sentiment bands.
Some long-term holders see the move as a potential buying opportunity. Analyst CryptoRover pointed out similarities to 2022, when bitcoin last entered this zone around $15,000 before eventually forming a cycle bottom.
Currently trading near $62,500, bitcoin is down about 50% from its October 2025 peak of $126,000. The decline has pushed the asset beneath the floor of the modern nine-band Rainbow Chart and into the original model’s purple “Bitcoin Is Dead” zone—typically a signal of extreme fear rather than a literal outlook.
The breakdown has sparked debate over whether bitcoin is now undervalued or whether the Rainbow Chart itself is losing relevance as institutional investors, ETFs and macroeconomic forces exert greater influence on the market.
Originally developed in 2014 by Reddit user Azop, the Rainbow Chart uses historical price behavior to map bitcoin’s long-term trajectory across different sentiment phases.
Opinions among analysts are divided. Markus Levin, co-founder of XYO, argued that the breach reflects a structural shift in the model rather than a failure of bitcoin itself, suggesting the asset has matured beyond the assumptions embedded in the chart.
Others disagree. Ryan Lee, chief analyst at Bitget, said the Rainbow Chart remains a helpful tool for visualizing long-term cycles, though he cautioned against treating it as predictive given its reliance on historical data rather than evolving macro and market dynamics.
Emad Shahin, COO of Ethra, echoed that view, describing the chart as more of a sentiment gauge than a forecasting tool, noting that such models often fail at key turning points.
Bitcoin’s inability to reach the chart’s upper red bands during its $126,000 peak—and its current drop below the lower boundary—highlights a growing divergence between price action and traditional models. Other frameworks, such as the Stock-to-Flow model, have also struggled to accurately predict bitcoin’s trajectory in recent cycles.
Mark Zalan, CEO of GoMining, emphasized that the “Bitcoin Is Dead” zone has historically marked periods of fear and undervaluation rather than permanent decline, often preceding recoveries.
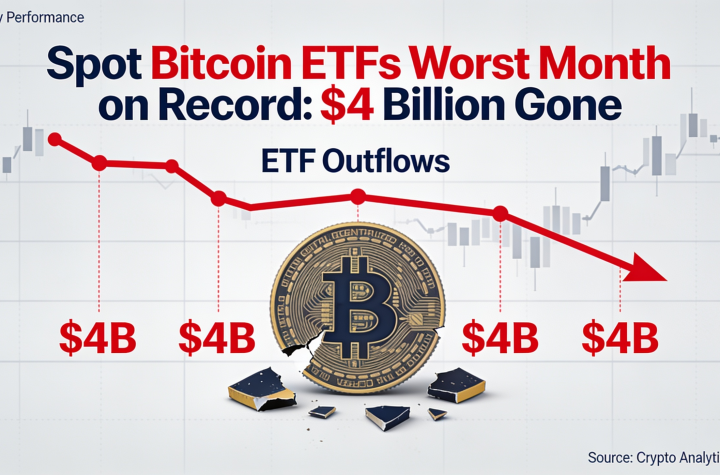
Still, he acknowledged the model is becoming less precise as market dynamics evolve. The increasing role of institutional capital, ETFs and derivatives has reshaped price discovery, making older models less reliable as standalone indicators.
Bitcoin is now trading close to its April 2024 halving level, defying expectations tied to the traditional four-year cycle.
Levin noted that the chart’s assumptions were built around a more retail-driven and illiquid market, whereas today’s bitcoin operates within a far larger, more complex financial system.
Analysts also pointed to the possibility that increased liquidity and institutional participation could be dampening the extreme volatility that once defined bitcoin’s cycles.
Lee added that while sentiment appears weak near the lower end of the Rainbow Chart, it does not necessarily signal further sharp declines. A move toward the low-$50,000 range remains possible if broader risk sentiment worsens, but the chart itself offers limited clarity on where a definitive bottom may form.
Whether bitcoin re-enters the Rainbow Chart’s historical range or continues trading outside it could determine if the model remains relevant—or joins a growing list of outdated crypto valuation tools.


More Stories
Strategy Launches Bitcoin Monetization Plan as Saylor Unveils Buybacks and Dividend Boost
Bitcoin Stalls Below $60K as Crypto Faces Crucial Week Ahead
Bitcoin Enters Technical No Man’s Land as Key Support Levels Drift Lower