
The key question is whether the current wave of selling pressure begins to form a reversal base, or whether it continues to dominate and push prices lower without relief.
Discover: The Best Crypto to Diversify Your Portfolio
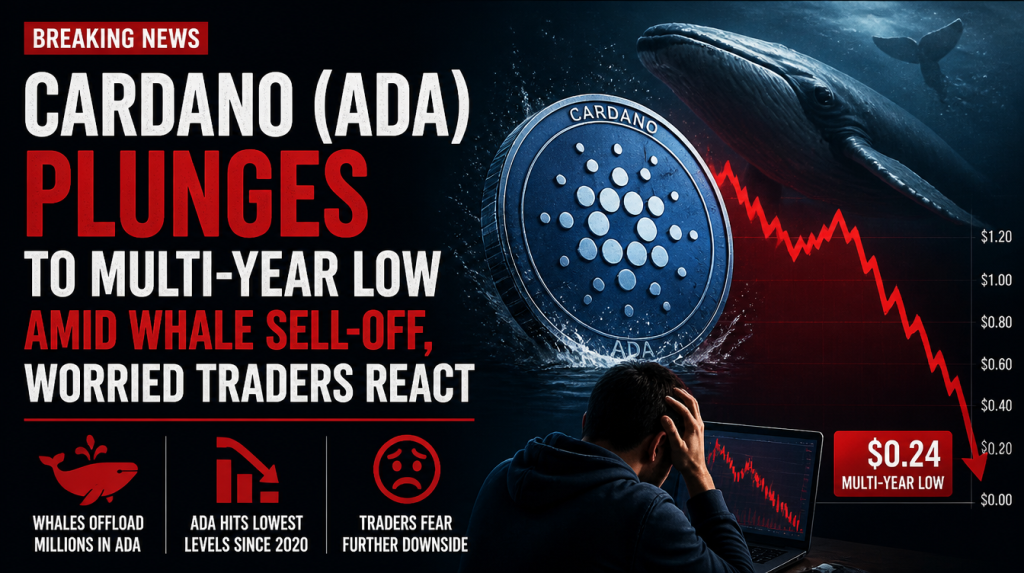
Cardano News: What On-Chain Activity and Whale Behavior Suggest
Santiment data shows a notable spike in Cardano’s Age Consumed metric alongside a flattening of Mean Dollar Invested Age as ADA dropped toward $0.1485. This pattern typically reflects previously inactive coins being moved, often associated with capitulation phases or large-scale redistribution rather than normal market turnover.
Whale flows add further confirmation of sustained distribution. Wallets holding 10–100 million ADA have reportedly sold around 180 million tokens over a short period, while the 1–10 million ADA cohort previously offloaded more than 560 million tokens within a four-day span.
This selling is also occurring within a broader macro-driven downturn. ETF outflows, institutional de-risking, and general risk-off sentiment across global markets have weighed on altcoins, meaning Cardano’s decline is part of a wider sector correction rather than an isolated breakdown.
From a technical standpoint, the 50-, 100-, and 200-day EMAs are tightly grouped between $0.23 and $0.33—well above current price levels. This configuration typically signals a structurally damaged trend rather than a temporary pullback within an uptrend.
Cardano Price Prediction: Where ADA Stands Next
Over the past two years, Cardano has completed a full boom-and-bust cycle on the weekly timeframe. After consolidating between $0.35 and $0.50 through mid-2024, ADA rallied sharply in late 2024, peaking near $1.35–$1.40 in early 2025.
That rally was followed by a prolonged sequence of lower highs and increasing volatility throughout 2025. Since mid-year, ADA has remained in a sustained downtrend, giving back most of its gains and recently printing lows around $0.1666. As of June 11, 2026, the token trades near that level, modestly higher on the week but still positioned near the lower boundary of its descending channel.
Momentum indicators continue to reflect weakness, with the RSI (14) sitting near 27.83, deep in oversold territory. While this raises the possibility of a short-term relief bounce or consolidation, the broader market structure remains firmly bearish. Price action has now returned to levels last seen in prior bear market phases, highlighting the scale of the retracement from the 2025 highs.


More Stories
Ripple’s XRP Facing Artificial Pressure? Analyst Explains Missing Breakout
Citi Moves Into Real-World Assets With Private Company Share Tokenization Platform
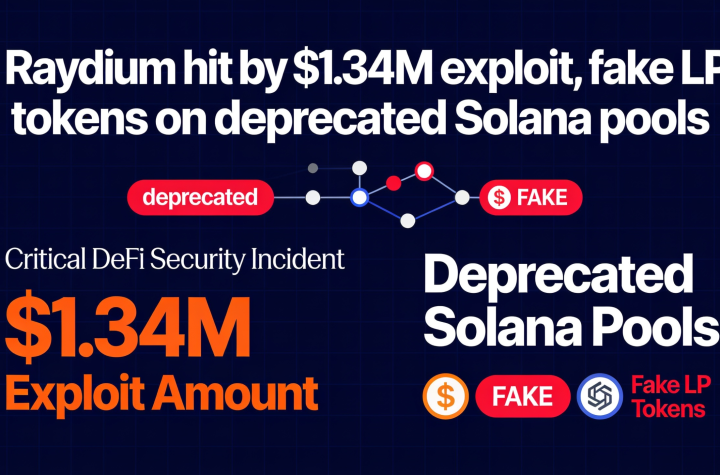
Hackers Exploit Old Solana Pools in $1.34M Raydium LP Token Incident