
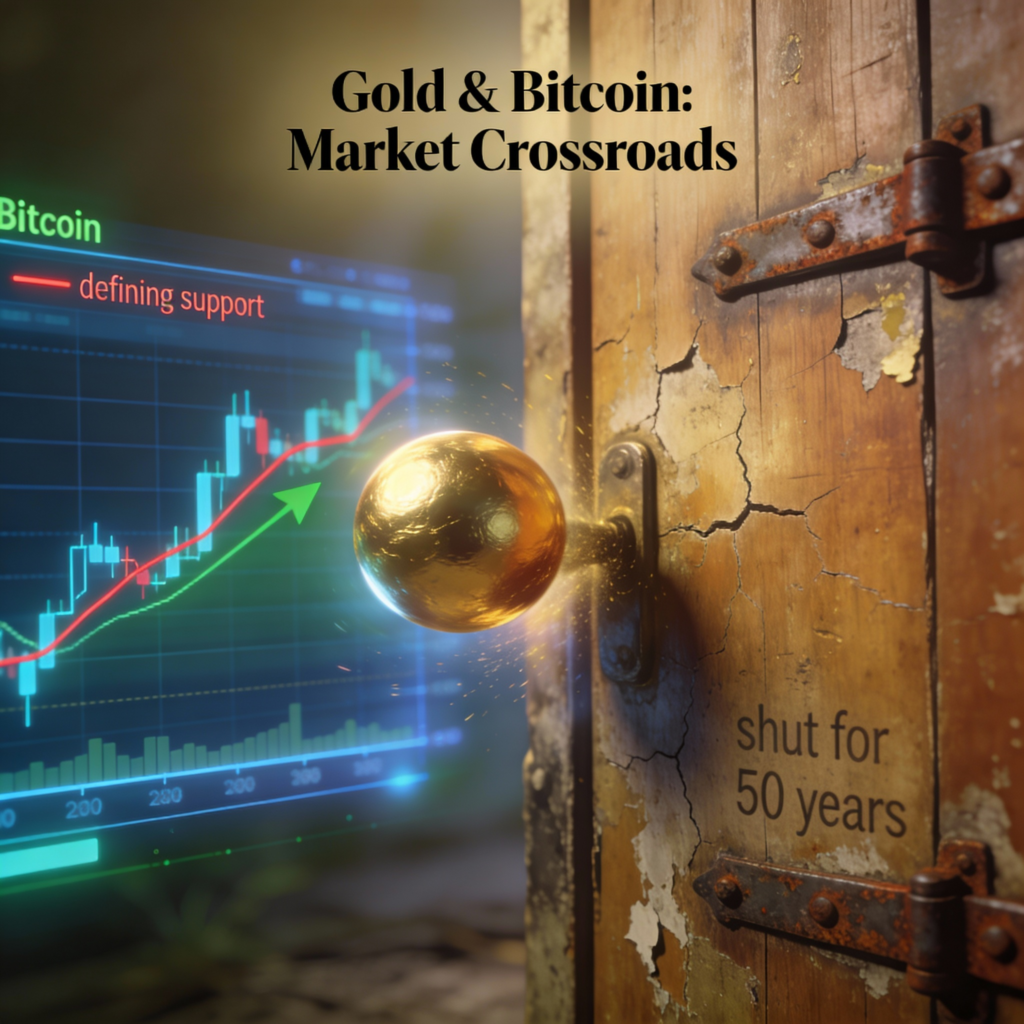
When adjusted for the size of the U.S. money supply, gold has climbed back to levels that historically coincided with major market peaks, while bitcoin is sliding toward a support zone that has defined past cycles.
Gold is now testing a critical threshold relative to U.S. money supply (M2SL), a level last reached in 2011 and previously surpassed only during the inflationary surge of the 1970s. That earlier episode ultimately saw gold prices more than triple, topping out near $700 an ounce at the time.
Bitcoin, often framed by proponents as “digital gold,” is moving in the opposite direction. The cryptocurrency has retreated toward a key support level, revisiting prices last seen during April’s “tariff tantrum.”
In 2011, gold traded around $1,800 an ounce. Today, it sits near $4,500. When viewed against the total stock of dollars in the U.S. economy — including cash, bank deposits and other liquid savings — gold is once again pressing into a resistance area that has historically marked important turning points.
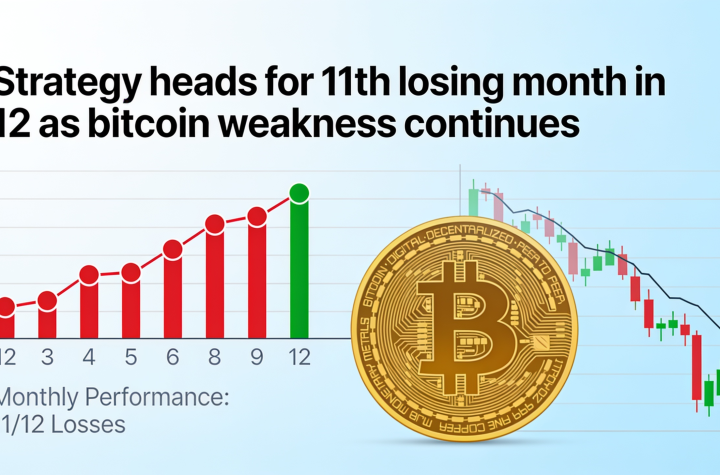
Gold’s return to that zone has been powered by a roughly 70% rally this year. Bitcoin, by contrast, is down about 10% over the same period. Even so, bitcoin continues to make new highs relative to the U.S. money supply each cycle, and the current pullback is testing a level that also marked the prior cycle peak in March 2024.
The divergence underscores the contrasting roles gold and bitcoin are playing as both assets approach technically significant levels.


More Stories
Nasdaq Pushes Market Data Onto Blockchain Rails in Distribution Expansion
Bitcoin’s Tight $59K–$60K Range Raises Risk of Sharp Breakdown
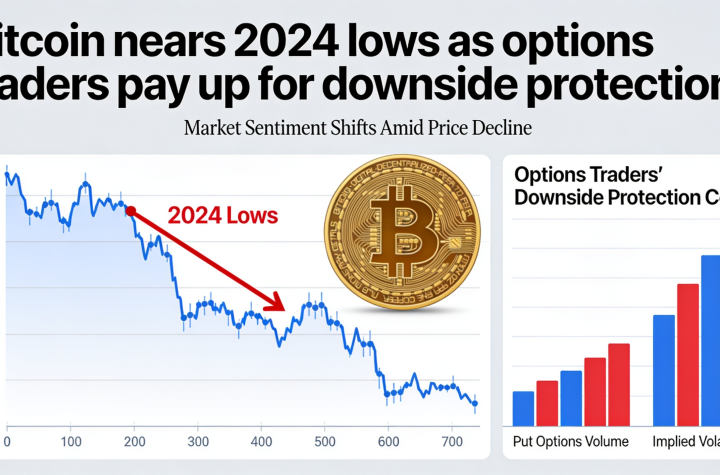
Bitcoin Slides Toward 2024 Lows as Traders Rush for Downside Hedges