

XRP Breaks July Uptrend as Bitcoin Stalls Below $120K, ETH and SOL Diverge
Bitcoin (BTC): Bullish Structure Intact, But Momentum Weakens
Bitcoin remains locked in a consolidation range between $116,000 and $120,000 after peaking at a record $123,181 on July 14. Multiple failed breakout attempts above $120K have led to range-bound trading, while the daily MACD histogram begins to hint at a bearish shift.
Intraday moving averages are flattening, pointing to fading momentum. Still, the broader uptrend from June remains unbroken, leaving room for a bullish continuation — if buyers can regain control above resistance.
- Resistance: $120,000, $123,181
- Support: $116,000, $115,739, $111,965
- AI View: Bitcoin’s momentum is waning beneath $120K; the MACD flip suggests increased risk of a near-term pullback.
XRP (XRP): Uptrend Line Snaps, Raising Downside Risk
XRP has breached its July uptrend line, threatening the bullish structure formed since its rally from $2.20. Price action has been choppy between $3.35 and $3.65, but the break of trend support now increases the risk of a bearish resolution.
Additionally, Bollinger Bands have widened to levels last seen before the December correction, signaling heightened volatility ahead. A breakdown below the $3.35 level could accelerate downside toward $3 and even $2.65.
- Resistance: $3.65, $4.00
- Support: $3.35, $3.00, $2.65
- AI View: Volatility expansion and trendline breach flag rising bearish pressure.
Ether (ETH): Cooling Off After Overheated Rally
ETH has pulled back from $3,850 to $3,600 after a steep climb from June’s $2,200 lows. Bollinger Bands have widened to their highest level since mid-2021, a typical signal that a cooling-off period is imminent.
The RSI has crossed into overbought territory, suggesting price action may now shift into consolidation as traders reassess.
- Resistance: $4,000, $4,109, $4,382
- Support: $3,480, $3,081, $2,879
- AI View: Indicators suggest short-term consolidation as ETH digests recent gains.
Solana (SOL): Bullish Setup Holds Amid Pullback
Solana is trading below $200 after recent highs, but technical signals remain constructive. The rising channel structure is intact, and moving averages are pointing upward across both intraday and daily timeframes.
Bollinger Bands are widening after a long compression period, while the 50-day moving average approaches a golden cross above the 200-day — a traditionally bullish sign.
- Resistance: $218, $252–$264
- Support: $187–$185, $163 (50-day SMA), $145
- AI View: Momentum remains strong; SOL continues to target the upper end of its ascending channel.


More Stories
Bitcoin Falls Under $66K While Oil Prices Jump Almost 20%
Crude exported from the Middle East climbs above $100 per barrel. Here’s the potential impact on bitcoin.
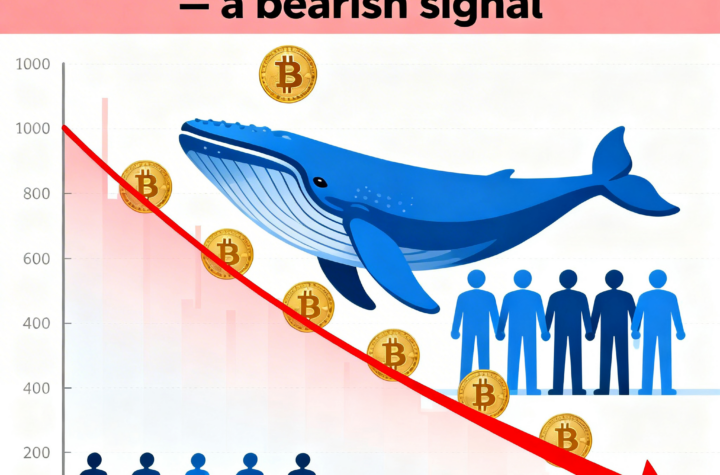
Bitcoin’s pullback may persist as whale selling into retail accumulation points to a bearish market signal.