

Bitcoin Soars Past $123K, but May Consolidate as Market Dynamics Shift
Bitcoin (BTC) shattered fresh records early Monday, pushing beyond $123,000 and extending the rally sparked by BlackRock’s IBIT breakout last week. Traders now have their sights set on the $140,000 mark, fueled by an extraordinary convergence of bullish catalysts.
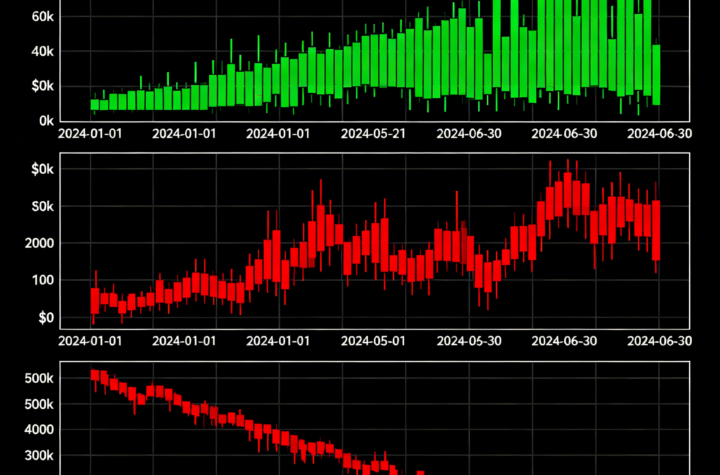
With a pro-crypto U.S. president advocating low interest rates, aggressive fiscal spending, and stock markets at new highs, conditions are ripe for bitcoin’s ongoing surge. Technical charts reflect that optimism: key indicators like the RSI and MACD show no bearish divergence, while the 50-, 100-, and 200-day SMAs remain firmly stacked in a bullish formation.
Momentum is further reinforced by rising cumulative open interest in BTC perpetual futures on offshore exchanges, signaling deep market engagement.
Yet despite the euphoria, there’s growing consensus that bitcoin could soon enter a consolidation phase between $120,000 and $130,000. Here’s why:
1. Options Market Makers Are Long Gamma
Data from Deribit via Amberdata reveals that options market makers are significantly long gamma between the $120,000 and $130,000 strikes, particularly across expirations on July 25, August 1, and August 29.
When market makers hold long gamma, they hedge dynamically—buying as prices fall and selling as they rise—to stay delta-neutral. This behavior tends to suppress large price swings, effectively “pinning” BTC within a range. A similar mechanism held prices in check between $108,000 and $110,000 earlier this month.
2. DVOL Shows Signs of Reversing
BTC’s climb from $70,000 to $122,000 has been notable for the breakdown in the usual positive correlation between the spot price and Deribit’s DVOL index, which tracks 30-day implied volatility. As bitcoin soared, DVOL drifted lower—a typical pattern during bull runs.
However, DVOL appears to have bottomed around an annualized 36% since late June. Technical signals like the MACD suggest DVOL could soon turn higher. If volatility rises while the spot price remains elevated, it could trigger a price correction given the current negative correlation between the two.
3. Dollar Index Reversal
The U.S. Dollar Index (DXY) has rebounded sharply this month, climbing nearly 17% to 97.00 and breaking its downward trend from earlier in the year. This recovery is partly tied to potential new U.S. sanctions on countries buying Russian oil, which could support energy prices and boost the dollar, as noted by ING in a client note.
A strengthening dollar often caps gains in dollar-denominated assets like bitcoin and gold, potentially limiting BTC’s near-term upside if the DXY’s recovery accelerates.
Key Technical Levels for BTC:
- Resistance: $130,000, $140,000, $146,000
- Support: $118,800, $116,650, $112,000
Ethereum Stuck in Expanding Triangle
Despite a robust 22% gain this month, Ethereum (ETH) remains confined within an expanding channel formed by trendlines connecting its May and June highs and lows.
While ETH is currently testing the upper boundary of that channel, the daily stochastic oscillator shows overbought conditions, suggesting that any breakout attempt may falter without a corrective pullback first. A confirmed breakout would put $3,400 firmly in focus for traders.
- Resistance: $3,067 (61.8% Fibonacci level), $3,500, $3,570, $4,000
- Support: $2,905, $2,880, $2,739, $2,600
Solana Strengthens After Weekend Dip
Solana’s SOL (SOL) remains firmly in bullish territory following Friday’s dual breakout, driven by an inverse head-and-shoulders pattern and a push above the Ichimoku cloud. Monday’s recovery from a minor weekend dip reinforces that momentum.
A decisive move past $168 would further cement the case for a rally toward $200.
- Resistance: $180, $190, $200
- Support: $150 (100-day SMA), $145, $125
XRP’s MACD Flips Bullish
XRP’s (XRP) weekly MACD histogram has flipped positive, mirroring the technical trigger that fueled bitcoin’s rally from $70,000 last year. Combined with the strongest 14-day RSI reading since December, this signals potential for a move beyond $3.00 and possibly toward new all-time highs.
However, traders should watch for bearish RSI divergences on shorter timeframes, which could signal short-term pullbacks.
- Resistance: $3.00, $3.40
- Support: $2.20, $1.90, $1.60
Takeaway:
Bitcoin’s fundamentals remain solid, with bullish technicals and a favorable macro backdrop. However, factors like market-maker hedging, rising volatility, and a resurgent dollar could anchor BTC in a

More Stories
Bitcoin Tops Stocks and Gold Amid Market Turmoil From Middle East Conflict
Bitcoin Gains Amid Oil Spike and Falling Stocks
Bitcoin Risks Deeper Declines With Odds of U.S. Market Crash Rising to 35%