

Dogecoin (DOGE) is trading steadily around $0.170 after rebounding sharply from earlier lows, as traders focus on a tightening symmetrical triangle pattern that could signal a significant price swing of up to 60%.
Despite broader market uncertainty driven by macroeconomic tensions, DOGE has shown resilience, bouncing back from a drop to $0.16, which has now established itself as strong support.
Market Context
- Analysts are closely watching DOGE’s technical setup. The symmetrical triangle, coupled with narrowing volatility and declining volumes, is a classic pattern that often precedes a large breakout.
- While the direction of the breakout remains uncertain, historical trends suggest a potential move as high as 60%, presenting both opportunity and risk for traders.
- The Federal Reserve’s upcoming policy announcement adds further uncertainty to already cautious risk markets, making DOGE’s technical position even more significant.
Price Action
Over the past 24 hours, DOGE traded within a 2.7% range, fluctuating between $0.167 and $0.172.
- An early session decline of 1.8% at 04:00 was reversed by strong buying activity at $0.168, accompanied by a spike in trading volume to 248 million DOGE—the day’s highest.
- After the rebound, DOGE entered a consolidation phase between $0.170 and $0.172, repeatedly testing the upper resistance.
- At 13:00, DOGE was pushed back from resistance at $0.172, facing selling volume of 193 million.
- A further dip between 13:45 and 13:51 saw volume spike again to 18.7 million, but the price held steady at $0.170, reinforcing that level as short-term support.
Technical Recap
- Range: DOGE moved within $0.167 to $0.172 over the past 24 hours (2.7%).
- Support: Firm buying at $0.168, confirmed by high-volume reversal.
- Resistance: Significant pressure at $0.172, rejected during heavy trading.
- Pattern: Symmetrical triangle pattern tightening, signaling a potential breakout.
- Indicators: RSI hovering around neutral at 50, with a flat MACD, indicating market indecision.
With volatility compressing and DOGE coiling tightly within its pattern, traders are keeping close watch for a breakout that could deliver a sharp move in either direction.

More Stories
Crypto advocates criticize Ray Dalio’s “tired narratives” while reaffirming confidence in bitcoin.
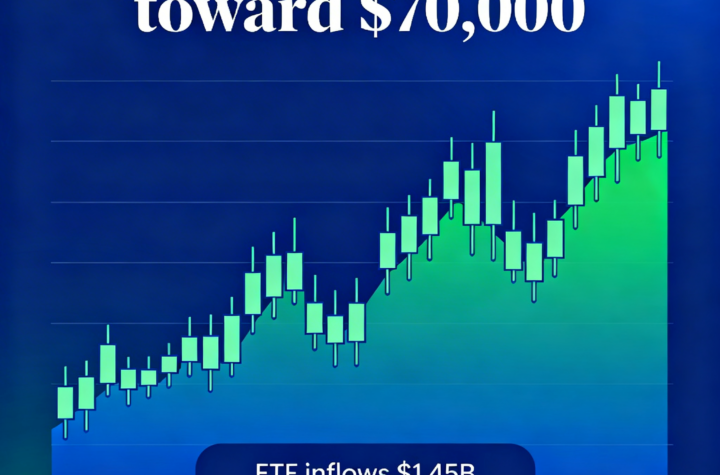
Bitcoin ETFs have attracted more than $1 billion in fresh capital, yet the asset’s price is barely reacting, analysts say.
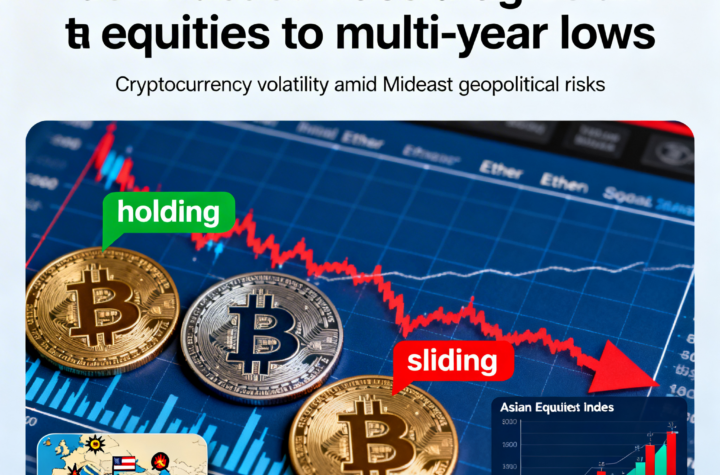
Bitcoin stabilizes as ether, solana decline amid Middle East turmoil hitting Asian markets.