

Technical indicators in both equities and crypto markets point to a potential return of bullish momentum.
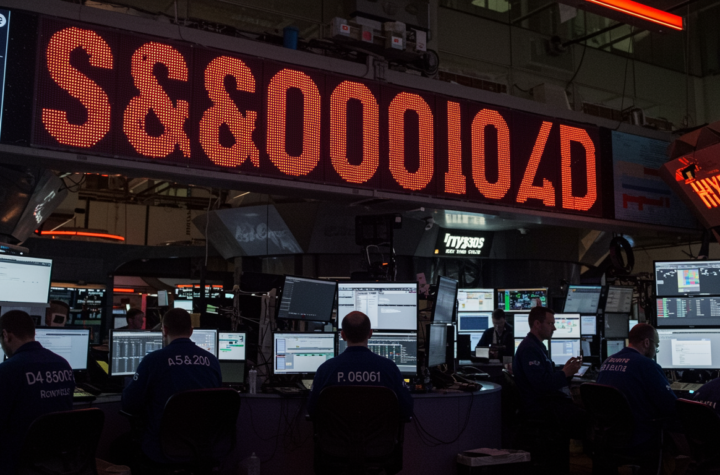
The S&P 500 gained 1.7% on Monday, continuing last week’s rally and reclaiming its 200-day moving average (200 DMA) after experiencing a nearly 10% pullback in recent months. The 200 DMA, which tracks the average closing price over the past 200 trading days, is often viewed as a critical indicator of long-term market trends.
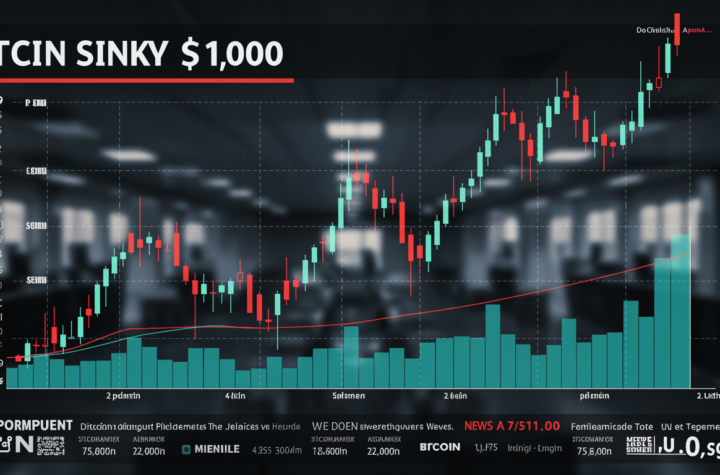
A similar breakout is occurring in Bitcoin (BTC), which has surged past $88,000 after decisively surpassing its own 200 DMA of $85,046 over the weekend. Historically, moves above this level have preceded further price appreciation.
The next major resistance level for Bitcoin is $93,245, aligning with the short-term holder realized price. This metric represents the average cost basis of recently moved coins, making it a key psychological and technical threshold. If Bitcoin can hold above its 200 DMA, traders may look for a continuation of the current uptrend.
More Stories
Bitcoin drops under $71,000 while stocks end the day near session lows as expectations for a 2026 Fed rate cut dim further.
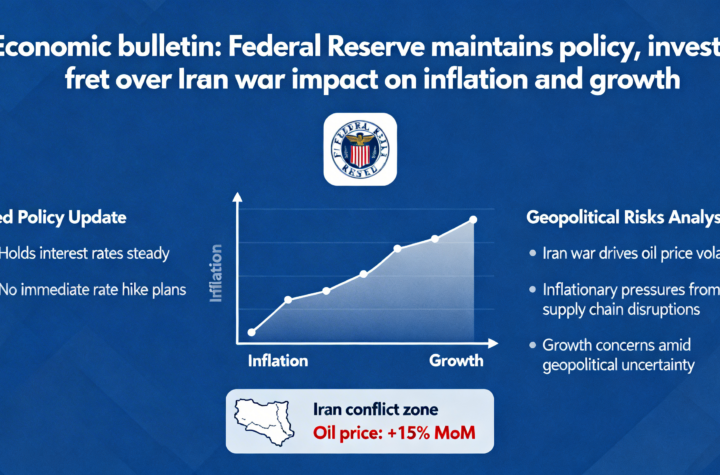
Fed pauses rate changes as the Iran conflict clouds the economic outlook and fuels inflation fears.
Cheap money is now behind us as ongoing conflict with Iran locks in a higher baseline for inflation.