

OBV Signals Potential Bitcoin Slide Below $100K
Bitcoin (BTC) has remained above $100,000 for four consecutive months, forming what appears to be a stable base for future upside. However, key volume data now points to underlying weakness that could precede a sell-off.
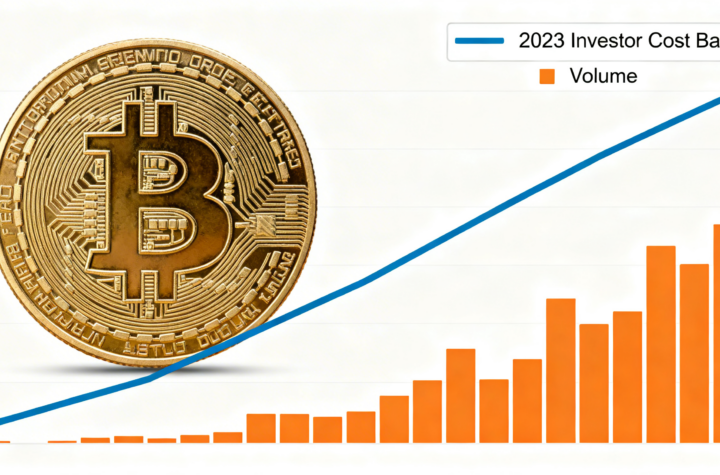
The On-Balance Volume (OBV) indicator—called the “grand daddy” of volume measures by Charles D. Kirkpatrick II and Julie R. Dahlquist—tracks cumulative trading volume, adding on up days and subtracting on down days. OBV is widely used to confirm trends and signal early breakouts or breakdowns.
BTC’s OBV has broken below its own range, reaching levels last seen on April 24, when BTC traded around $94,000. This decline suggests waning demand, even as BTC price holds above $100K.
Other momentum signals reinforce caution. The MACD histogram on the weekly chart is forming deeper bars below zero, pointing to increasing downside pressure.
Key levels to watch:
- Support: $107,300 marks short-term support, with a potential drop toward $99,225 if broken.
- Resistance: The 50-day SMA remains critical for bulls to regain momentum.
Despite BTC’s recent stability, these indicators suggest a potential pullback below $100K may be on the horizon, emphasizing the need for careful risk management.

More Stories
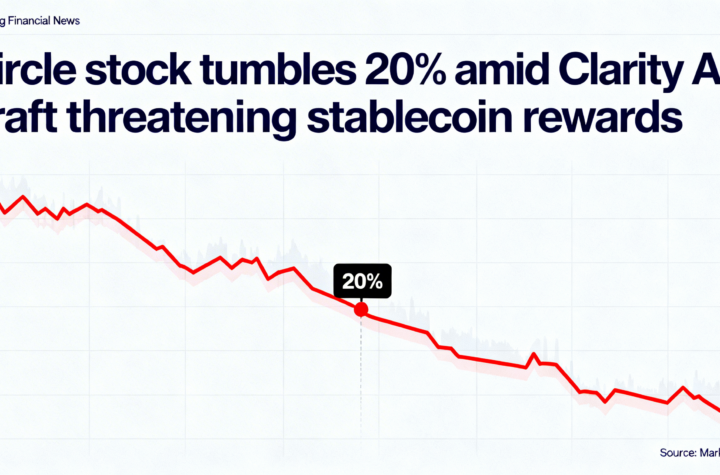
Circle stock drops 20% after new Clarity Act draft threatens stablecoin yield incentives.
Bitcoin falls under $70K, with Circle’s 16% slide leading declines in crypto stocks.
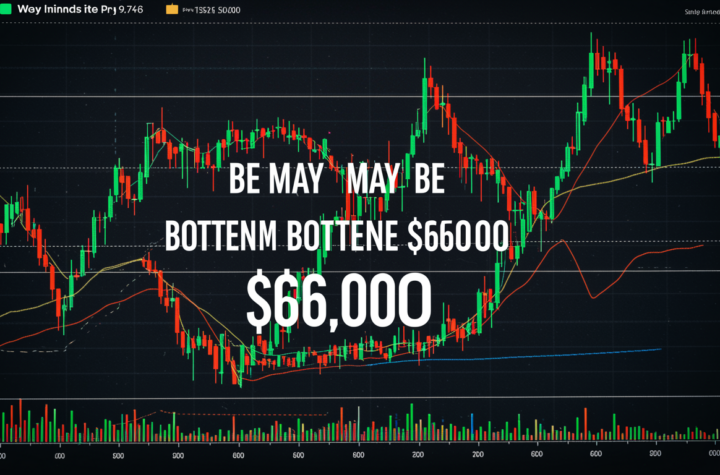
Has Bitcoin already bottomed near $60,000? Here’s why it might have.