
Historical precedent suggests bitcoin’s latest momentum reset could translate into an extended stretch of consolidation near $60,000 before the next sustained advance unfolds.
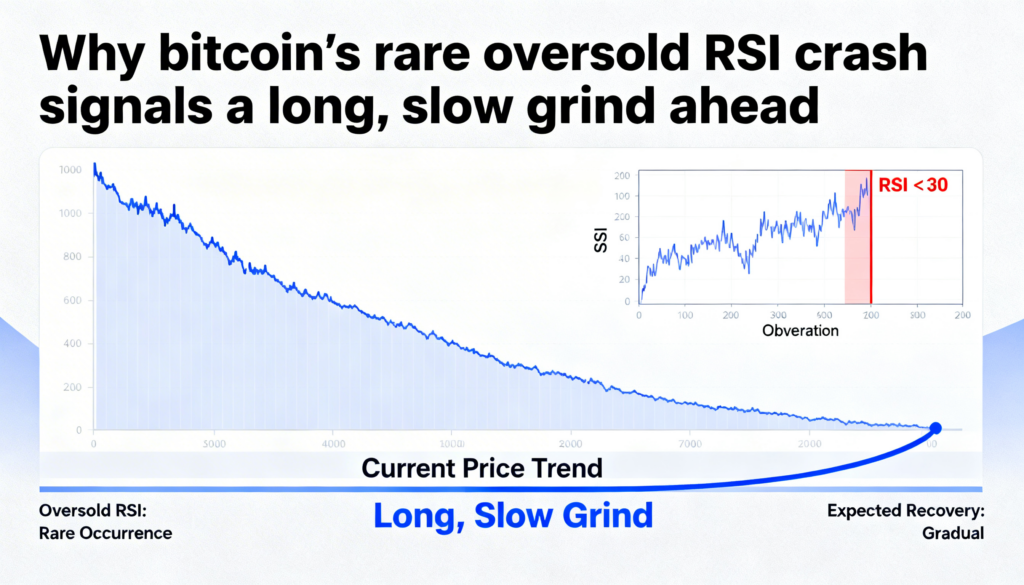
Earlier this month, bitcoin’s 14-day Relative Strength Index (RSI) fell below 30 for only the third time in its history, according to data from Checkonchain.
The RSI is a commonly used momentum indicator that gauges the pace and magnitude of recent price movements by comparing average gains and losses over a 14-day window. The oscillator ranges from 0 to 100, with readings above 70 typically signaling overbought conditions and levels below 30 pointing to oversold territory — a sign that selling pressure may be exhausted. Notably, bitcoin’s RSI has not reached extreme overbought levels since December 2024, when the cryptocurrency first pushed beyond $100,000.
Past instances of RSI dipping under 30 have aligned with major cycle lows. In January 2015, the RSI slid to roughly 28 as bitcoin traded near $200. That move was followed by about eight months of sideways accumulation before a durable uptrend emerged. A similar scenario played out in December 2018, when the RSI dropped below 30 around the $3,500 mark, preceding roughly three months of consolidation before prices broke higher.
Bitcoin is currently changing hands near $66,000, with market sentiment entrenched in “fear” or “extreme fear” territory on the Crypto Fear & Greed Index for much of the past 30 days. Since reaching its October peak, the asset has fallen more than 50%, at one point nearing $60,000.
If historical patterns hold, the latest oversold reading may signal a prolonged period of range-bound trading around the $60,000 region before the next leg of the bull cycle takes shape.


More Stories
Circle and Nomura Partner to Tap Japan’s $440 Billion Daily FX Market
Crypto Relief Rally Fizzles as Bearish Derivatives Signals Persist
Bitcoin Supply in Loss Hits Record 10.83 Million BTC