
Bitcoin’s latest selloff has reignited fears of a deeper downturn, with historical data pointing to the 200-week moving average as the level investors may need to watch most closely.
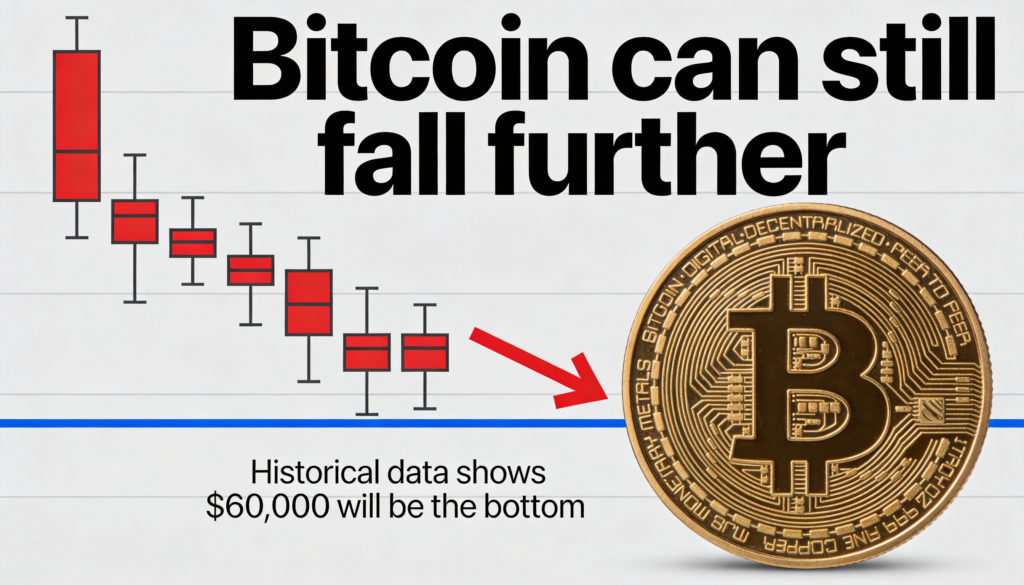
The world’s largest cryptocurrency fell 11% last week to around $74,800, its steepest weekly decline since March 2025. While the drop has already rattled sentiment, technical indicators suggest the bulk of the downside may still lie ahead. A move toward $58,000—about 25% below current levels—would bring bitcoin in line with its 200-week moving average, a support level that has historically marked bear-market bottoms.
Bitcoin’s recent weakness, combined with a lack of sustained buying interest, has fueled concerns that the market could be entering another prolonged “crypto winter.” Past cycles suggest that major bottoms are rarely formed quickly, often following extended periods of drawdowns and consolidation.
The 200-week moving average, which reflects bitcoin’s average closing price over nearly four years, is widely used as a long-term trend and momentum gauge. It also serves as a reference point for bitcoin’s traditional four-year cycle. In every prior cycle, the level has either marked or closely aligned with major market lows. It currently sits near $57,900.
Historically, bitcoin has tended to peak in the fourth quarter of the final year of each cycle. In the current cycle, it reached a record high of $126,000 in October and has since fallen roughly 40%. Last week’s decline also pushed bitcoin below the Ichimoku Cloud on the weekly chart, a technical indicator used to assess momentum, trend direction, and support.
Trading above the Ichimoku Cloud typically signals strong bullish conditions, while sustained moves below it indicate weakening momentum and elevated downside risk. Bitcoin’s recent break below the cloud represents a bearish shift that, in previous cycles, has coincided with the onset of the most severe phases of bear markets.
Price action continues to broadly track the four-year cycle theory, which is closely linked to bitcoin’s halving schedule. The halving, which reduces new supply by 50% approximately every four years, has historically contributed to recurring boom-and-bust market patterns.
During the 2015 bear market, bitcoin repeatedly found support near the 200-week moving average at prices just above $200. In the 2018–2019 downturn, the level—then near $3,000—again acted as a floor, aside from a brief breakdown during the Covid-related market shock in March 2020.
In the most recent cycle, bitcoin fell below the 200-week moving average in June 2022, dropping under $22,000 and remaining below the line for more than a year. The price did not reclaim the level until October 2023, underscoring its importance as a long-term support threshold.
While history offers no guarantees, the combination of a break below the Ichimoku Cloud and proximity to the 200-week moving average suggests bitcoin could face further downside before finding a durable bottom—albeit near a level that has repeatedly provided support in past cycles.

More Stories
Several bitcoin indicators continue to trend negatively, casting doubt on the bullish $70,000 support narrative
Another 500 bitcoin moved by Bhutan to exchanges, bringing total 2026 outflows above $150 million.
Circle’s recent decline may be overstated, with analysts pointing to a crypto bill that undercuts Coinbase’s edge.