

The Psychology Behind the Breakout and Retest Strategy
The breakout and retest pattern in trading is deeply rooted in investor psychology and market behavior.
Think about the last time you left for a trip. After locking your door and stepping away, you likely turned back to double-check if it was secure before continuing. Financial markets often display similar behavior—when an asset breaks through a key resistance level, it frequently revisits that point to confirm its strength before continuing in the breakout direction.
This phenomenon, known as the “breakout and retest play,” is widely recognized across different asset classes. Bitcoin’s (BTC) recent pullback may be a textbook example of this pattern—a natural retest of the previous resistance-turned-support at $73,757, which was first breached in November.
Bitcoin’s Decline: A Healthy Pullback?
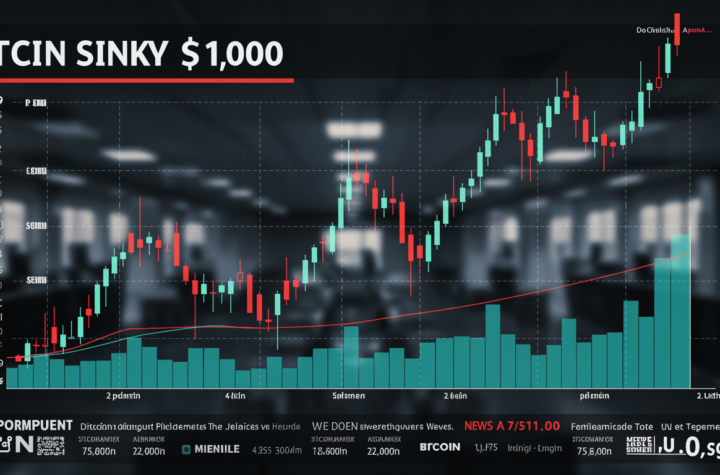
Bitcoin has dropped over 15% this month, falling below $80,000 and testing the key level of $73,757. This price point was initially surpassed in early November when Bitcoin broke out of a prolonged consolidation phase following the election of pro-crypto candidate Donald Trump as U.S. President.
Markets often return to their breakout levels before making larger moves, largely due to investor behavior. Many traders prioritize securing profits rather than letting their positions run, a concept explained by prospect theory. This tendency often causes post-breakout rallies to lose momentum, leading to a retest of the breakout point. Since December, BTC holders have been locking in profits near the $100K mark, contributing to the recent decline.
As prices approach the $73,757 support level, traders who missed the initial breakout may see this as an opportunity to buy, reinforcing the support and setting the stage for another rally. Similar setups played out in Q3 2023 and August-September 2020, both of which resulted in record highs following successful retests.
The Risks of a Failed Retest
While historical trends suggest that successful retests often precede major rallies, traders must be cautious. A failed retest—where the price breaks below key support without rebounding—could signal underlying weakness and lead to a more prolonged downtrend.
Several financial markets have exhibited the breakout-retest pattern. Japan’s 10-year government bond yield, for example, formed a double-bottom breakout in January 2024, revisited the breakout level multiple times, and then surged to multi-year highs. Similarly, the AUD/USD currency pair fell below a major support trendline in December, briefly retested the level earlier this month, and has since experienced steep losses.
Another strong example is the S&P 500’s behavior in early 2019. After breaking through a significant resistance level at 2,800 in February, the index retraced to test the level in March before rallying to new all-time highs. This move reinforced market confidence and triggered continued bullish momentum.
Conclusion
Bitcoin traders should closely monitor price action around the $73,757 support level. If it holds, this could serve as a foundation for the next major rally. However, if BTC breaks below this level, a deeper correction may be on the horizon.
Market cycles are largely influenced by investor psychology. Understanding these patterns can offer traders valuable insights into potential price movements and trading opportunities.

More Stories
Bitcoin drops under $71,000 while stocks end the day near session lows as expectations for a 2026 Fed rate cut dim further.
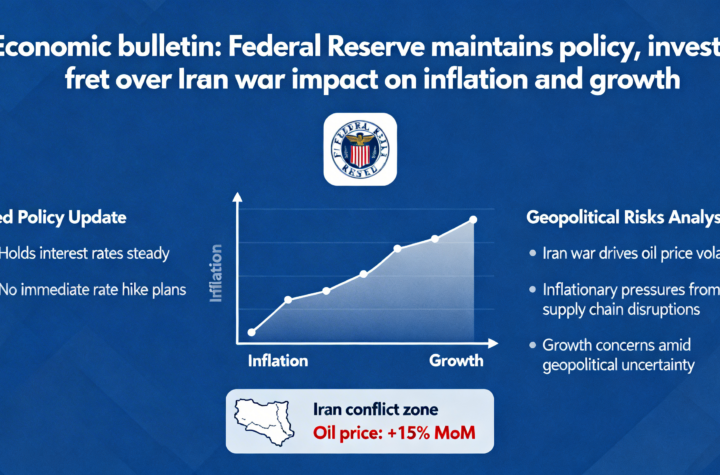
Fed pauses rate changes as the Iran conflict clouds the economic outlook and fuels inflation fears.
Cheap money is now behind us as ongoing conflict with Iran locks in a higher baseline for inflation.