

Bitcoin’s Volatility Gauge Tightens to February Levels, Signaling Imminent Breakout
Bitcoin (BTC) continues to trade within a narrow range of $116,000 to $120,000, with Bollinger Bands tightening to their narrowest point since February. This technical pattern often precedes a major price move, as it signals a buildup of volatility.
Earlier this year, a similar compression in Bollinger Bands led to a sharp sell-off from $95,000 to $80,000. Current price behavior suggests the market is coiling, potentially setting up for another sharp breakout — direction still uncertain.
The seasonal spike in equity market volatility, as reflected in the VIX, could spill over into crypto markets in August. A decisive move below $116,000 could see BTC test $111,965. On the upside, a clean break through $120,000 could push prices to new all-time highs.
- Key Resistance: $120,000, $123,181
- Key Support: $116,000–$117,000, $114,700, $111,965
- AI Insight: Periods of low volatility after a rally often precede explosive moves. Expect heightened activity soon.
XRP Sets Lower High, Eyes Key Support as Momentum Weakens
XRP declined by 3.6% on Monday, closing with a long upper wick — an indication of strong selling pressure. The token has now posted a lower high at $3.33, following its recent peak at $3.65. This formation, combined with a bearish tweezer top, points to continued downside pressure.
Failure to hold above $3.35 may open the door for a drop toward $2.95 and possibly $2.65, the May high. Bulls must reclaim $3.35 to challenge the bearish trend.
- Resistance Levels: $3.35, $3.65, $4.00
- Support Levels: $2.95, $2.65, $2.44 (200-day SMA)
- AI Insight: A failure to regain $3.35 confirms a bearish reversal pattern and puts key support zones at risk.
Ether’s RSI Bearish Divergence Suggests Cooling Momentum
Ethereum (ETH) has shown signs of slowing momentum as its 14-day Relative Strength Index (RSI) diverges from price action — a bearish signal. At the same time, the MACD histogram is on the verge of flipping negative, suggesting possible downside follow-through.
Traders are now watching the July 24 low of $3,510. A break below that level could trigger a larger correction, with $3,000 in play as the next support zone.
- Resistance Levels: $4,000, $4,100, $4,382
- Support Levels: $3,731, $3,510, $3,000
- AI Insight: Bearish RSI divergence is often a precursor to price corrections, especially after sustained rallies.
Solana Breaks Down After Forming Lower High, Bearish Pattern Takes Hold
Solana (SOL) is displaying classic signs of a trend reversal. The token set a lower high at $195, reinforcing the bearish tweezer top pattern formed near $205–$206. It has also broken down from a short-term ascending channel and slipped below the hourly Ichimoku cloud — both bearish indicators.
Unless SOL can reclaim $195 quickly, further downside could follow. Initial support sits at $184, followed by deeper levels at $163 and $126.
- Resistance Levels: $195, $205–$206, $218
- Support Levels: $184, $163, $126
- AI Insight: The combination of a tweezer top and lower high strongly signals the end of Solana’s recent uptrend.


More Stories
Crude exported from the Middle East climbs above $100 per barrel. Here’s the potential impact on bitcoin.
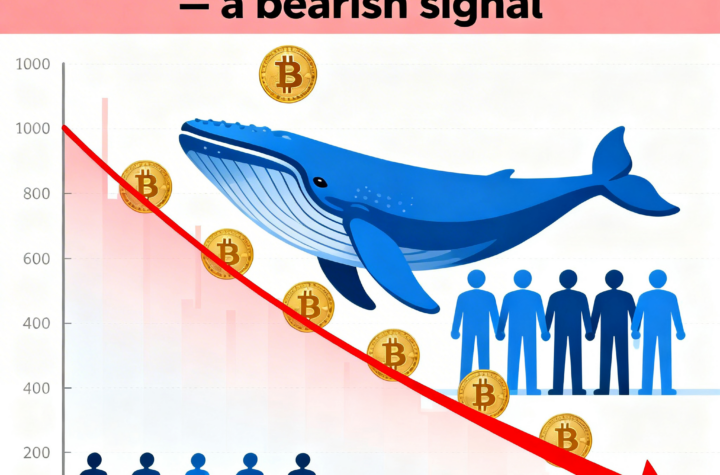
Bitcoin’s pullback may persist as whale selling into retail accumulation points to a bearish market signal.
Despite behaving like a tech stock at times, bitcoin continues to offer portfolio diversification benefits, according to an analyst