

BTC Volatility Triggered: MACD-Bollinger Spread Turns Positive, Hinting at Breakout Potential
A renewed uptick in volatility could soon shape Bitcoin’s next major move, as a historically reliable technical signal just flipped bullish.
The signal stems from the MACD applied to the Bollinger Band spread — a measure of the distance between the upper and lower bands based on two standard deviations from Bitcoin’s 20-week simple moving average.
Typically, when the band spread widens, it reflects increased volatility and elevated market activity. When coupled with a positive MACD crossover on the spread, it has historically preceded major uptrends in BTC price.
That crossover just occurred.
The MACD histogram, tracking momentum in the Bollinger Band spread, has flipped above zero, a technical shift that previously signaled the start of major rallies — most notably in Q4 2020 and again in late 2024.
While volatility is inherently direction-neutral, the context surrounding this latest signal favors a bullish interpretation. BTC remains near structurally important levels, and previous instances of this signal have rarely resulted in downside moves without clear macro triggers.
Traders watching this setup note three core panels:
- Top: BTC weekly OHLC candlesticks,
- Middle: Bollinger Band spread (volatility range),
- Bottom: MACD histogram applied to the spread — now turning positive.
This evolving structure suggests the market may be entering a volatility expansion phase, with directional resolution likely in the coming weeks. While not a guarantee of upside, past data shows bulls have historically come out ahead when this combination of signals emerges.
As technicals tighten and volatility stirs, Bitcoin may soon choose a direction — and history favors the upside.
More Stories
Bitcoin ETFs have attracted more than $1 billion in fresh capital, yet the asset’s price is barely reacting, analysts say.
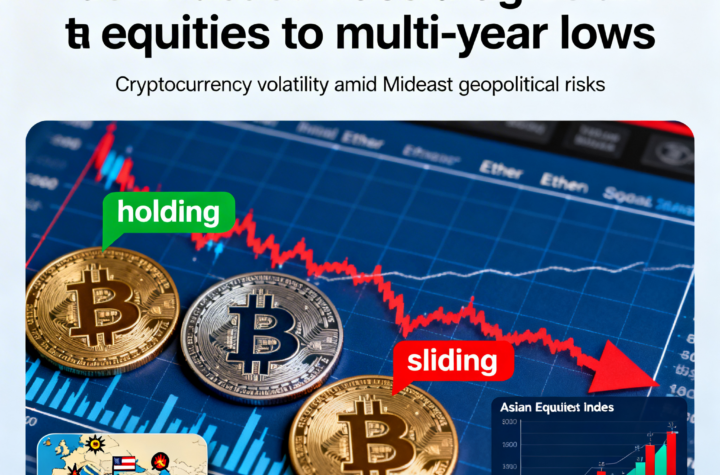
Bitcoin stabilizes as ether, solana decline amid Middle East turmoil hitting Asian markets.
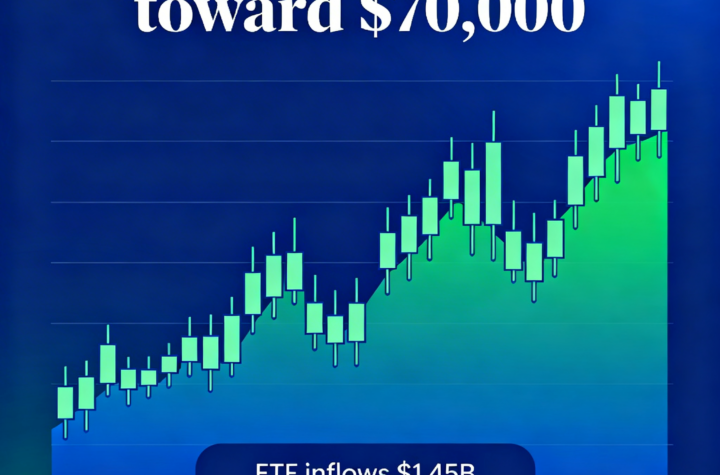
Bitcoin rebounds near $70,000 with $1.45B flowing into ETFs in the past five sessions.