

Bitcoin Slides to $105K as Resistance Rejection Confirms Bearish Setup
Bitcoin (BTC) faced renewed selling pressure in Wednesday’s Asian session after bulls failed to reclaim the $107,250 resistance level — a key threshold that previously acted as support before the early-November breakdown.
The rejection reinforces bearish momentum and adds weight to a looming “death cross” pattern, where the 50-day simple moving average (SMA) dips below the 200-day SMA. The signal typically reflects weakening short-term strength against the broader trend and often precedes extended downtrends.
Still, traders note that recent death crosses — in September 2023, August 2024, and April 2025 — all produced false bearish signals. For now, Bitcoin remains trapped between firm support at $100,000 and overhead resistance near $107,250, with a confirmed breakout needed to reset directional bias.
A decisive move below $100,000 could expose deeper liquidity gaps, while a recovery above resistance would reopen a path toward the $112,000–$115,000 region.
Ether Drops 1.5% After Breaking $3,590 Support
Ether (ETH) declined 1.5% on Tuesday, falling from $3,629 to $3,576 as bears regained control after rejecting an early push toward the $3,646 resistance zone. According to CoinDesk Research, the session’s 338,852 contracts traded marked a 138% spike in volume, confirming strong institutional selling pressure.
The breakdown below $3,590 — a level that had previously served as a key demand zone — solidified a short-term bearish structure. ETH briefly touched an intraday low of $3,532 before stabilizing within a $3,565–$3,589 consolidation range.
Despite recent institutional inflows from Republic Technologies and BitMine, technical momentum indicators continued to weaken, suggesting distribution outweighed accumulation through the session.
Technical Overview: ETH Structure Turns Cautious
- Support/Resistance: Immediate support sits at $3,510–$3,530, while the broken $3,590 level now acts as resistance.
- Volume Trend: Breakdown volume exceeded the daily average by 138%, signaling decisive participation from larger traders.
- Chart Formation: Lower highs since $3,646 confirm a developing bearish continuation pattern.
- Targets: Next downside zone lies between $3,480–$3,500, while recovery above $3,590 would signal a potential shift in momentum.
Market Context — CD5 Index Steadies Amid Volatility
The CoinDesk Index 5 (CD5) inched up slightly from $1,840 to $1,843 over the past 24 hours, reflecting modest stabilization across large-cap crypto assets. The index briefly reached $1,869 before sellers resurfaced, keeping markets range-bound as traders reassess risk ahead of macro catalysts.

More Stories
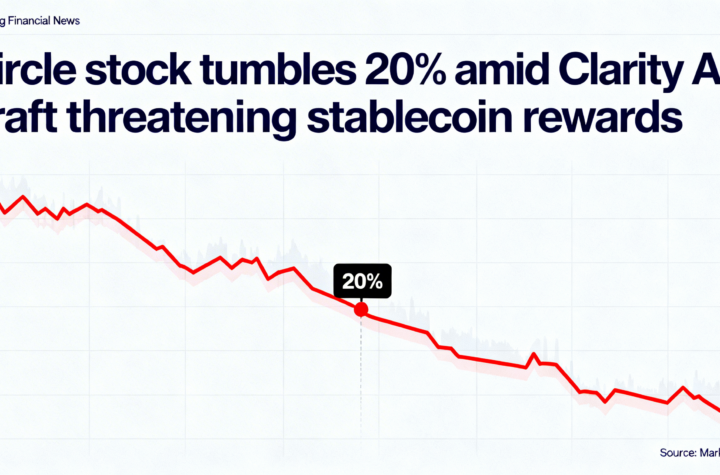
Circle stock drops 20% after new Clarity Act draft threatens stablecoin yield incentives.
Bitcoin falls under $70K, with Circle’s 16% slide leading declines in crypto stocks.
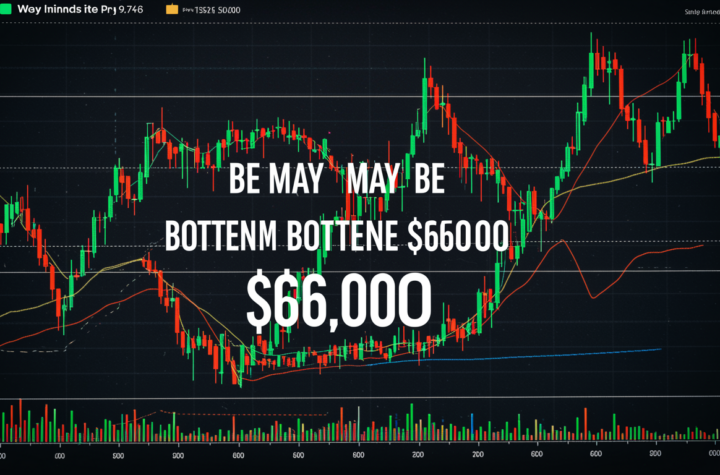
Has Bitcoin already bottomed near $60,000? Here’s why it might have.