

Bitcoin Tests Critical Fibonacci Resistance at $122K as Bulls Pause
Bitcoin is struggling to break past a key resistance zone near $122,056 — the 1.618 Fibonacci extension based on the 2018 and 2022 cycle lows and the 2021 high. Often referred to as the “golden ratio,” this level is closely watched by technical analysts for its significance in marking potential trend exhaustion.
BTC’s latest rally above $70,000 marked a new cycle high in November, setting the stage for the 1.618 level to become a magnet for profit-taking and renewed selling pressure. So far, price action has stalled just below it, suggesting bullish momentum may be weakening. A breakout would shift attention to the 2.618 Fib extension at $187,929, while a continued failure at $122K could signal a cycle top is forming.
BTC Key Levels:
- Resistance: $120,000, $122,056, $123,181
- Support: $116,000, $114,700, $111,965
XRP Holds $2.995 as Bulls Eye Breakout from Double Bottom
XRP is defending the $2.995 level, which corresponds to the 38.2% retracement of its recent uptrend. Price action on the hourly chart hints at a potential double bottom, with neckline resistance at $3.33. A successful breakout could open the way to $3.65, the recent peak.
However, broader momentum indicators remain cautious. The daily MACD is in negative territory and short-term averages are sloping down, pointing to lingering bearish pressure. A drop below $2.995 would invalidate the bullish structure and may trigger further downside.
XRP Key Levels:
- Resistance: $3.33, $3.65, $4.00
- Support: $2.995, $2.65, $2.58
Ether Forms Wedge, Bearish Momentum Grows
Ether is coiling within a wedge formation, showing indecisiveness amid softening momentum. The MACD histogram on the daily chart has turned negative, and key hourly moving averages have flattened — a signal that bullish conviction is fading.
If ETH breaks below the July 25 low at $3,510, it may confirm a short-term reversal toward the $3,000 level. On the upside, the $4,000–$4,100 resistance zone remains the major breakout area, with a close above potentially reigniting bullish sentiment.
ETH Key Levels:
- Resistance: $3,941, $4,000, $4,100
- Support: $3,510, $3,000, $2,879
Solana Risks Breakdown from Rising Channel
Solana’s upward channel, established since late June, is under pressure as price action nears the lower boundary. A decisive break below trendline support would suggest a shift in market structure, potentially setting up a test of clustered moving averages between $160–$162.
Bulls must reclaim the July 28 high at $195 to reestablish dominance. If rejected again, downside targets include the 61.8% Fibonacci retracement level at $156 and the June base near $126.
SOL Key Levels:
- Resistance: $195, $206, $218
- Support: $160–$162, $156, $126
More Stories
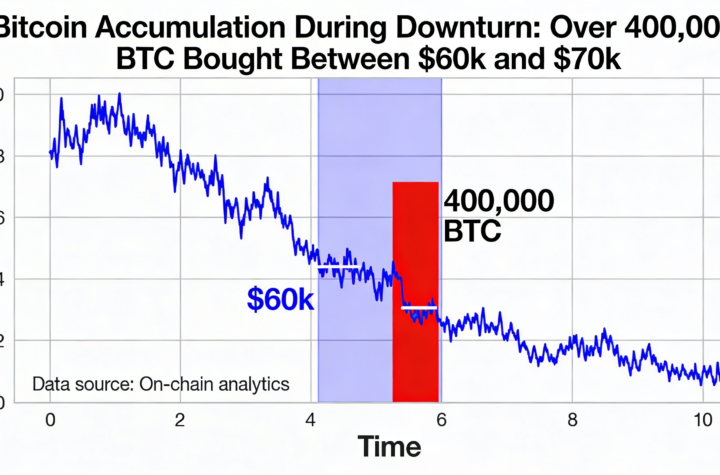
Over 400K Bitcoin purchased as prices hovered between $60K and $70K in the recent sell-off
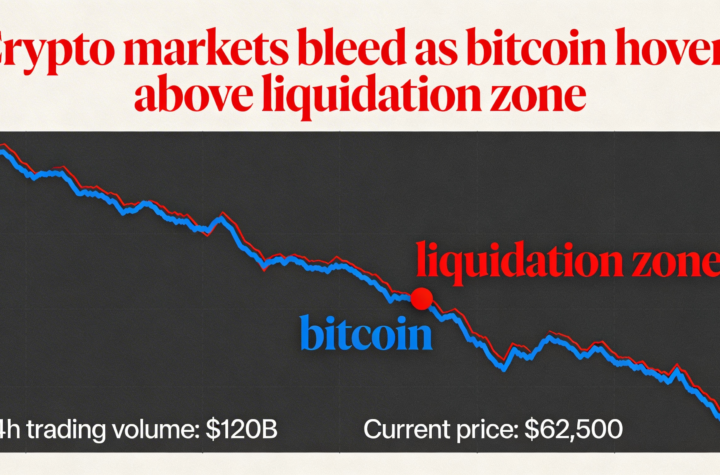
Broad Crypto Sell-Off Deepens While Bitcoin Trades Near Critical Liquidation Zone
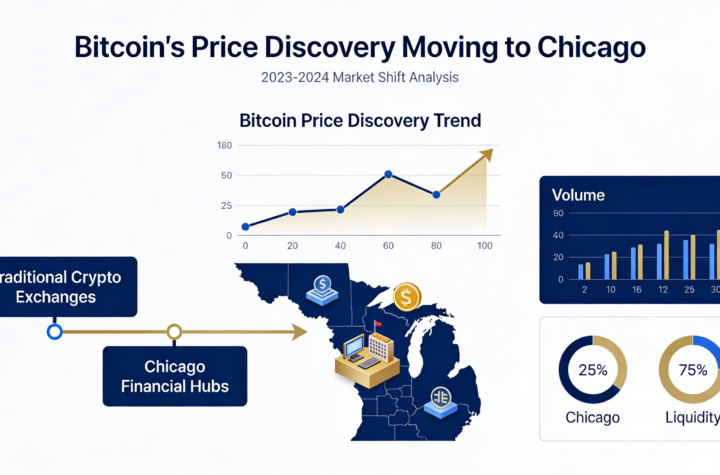
Bitcoin Trading Momentum Signals Price Discovery Migration to Chicago