
Bitcoin has slipped beneath a key technical floor, breaking a structure that had anchored bullish sentiment for more than a year.
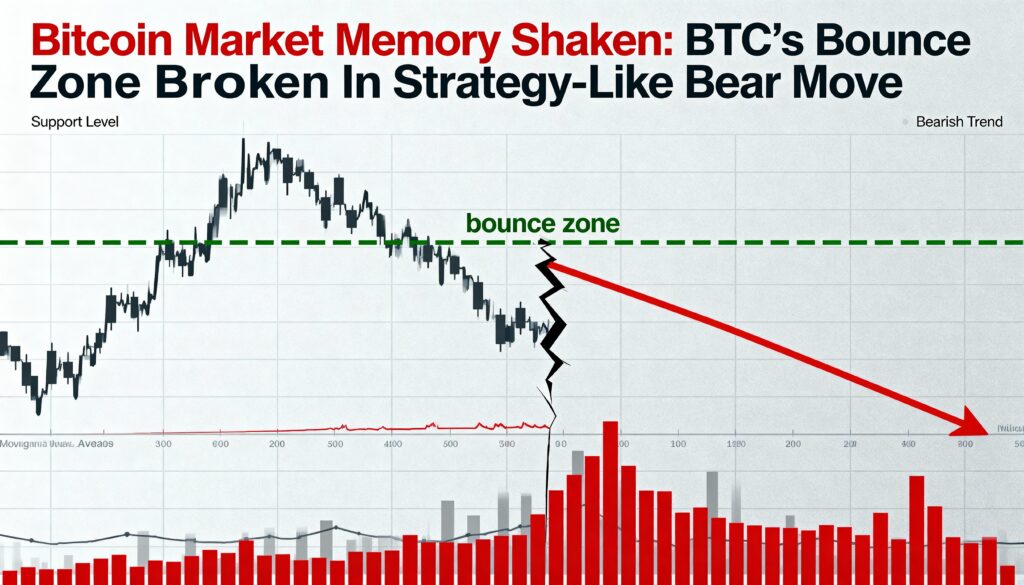
BTC, recently trading near $90,091.77, has now mirrored the pattern seen earlier in Strategy (MSTR), dropping below a level traders had long relied on as a consistent rebound zone. The cryptocurrency fell almost 10% over the week ending Nov. 16, closing the period with a sizable red candle that pushed decisively under the 50-week simple moving average (SMA), according to TradingView.
The move represents a clear breakdown of a major demand area and signals a shift away from the entrenched buy-the-dip playbook. With that long-protected zone now breached, traders may begin adopting a more defensive posture, treating rallies as opportunities to sell rather than stepping in aggressively on declines.
Since early 2023, the 50-week SMA had acted as a reliable safety net, repeatedly catching pullbacks and supporting fresh pushes to all-time highs as buyers consistently defended the level.
Strategy’s chart offers a striking precedent. When MSTR broke below its own 50-week SMA, confidence eroded quickly and the stock entered a prolonged sell-off. CoinDesk previously noted the bearish implications of MSTR’s breakdown, cautioning that Bitcoin could face a similar trajectory — which now appears to be materializing.
With BTC now below this long-term average, the former support has flipped into resistance. Any attempt to bounce is likely to face headwinds near the $102,868 region. A series of weekly closes back above that level would be required to argue for a renewed bullish trend.
MSTR — the largest public company holding bitcoin on its balance sheet — slipped under its 50-week SMA in September and has since slid toward $200, its lowest level since October 2024.


More Stories
Bitcoin holds near $68,300 while gold tumbles for a ninth session and Asian stocks fall
Resolv stablecoin drops 70% as exploiter siphons $25 million worth of ETH
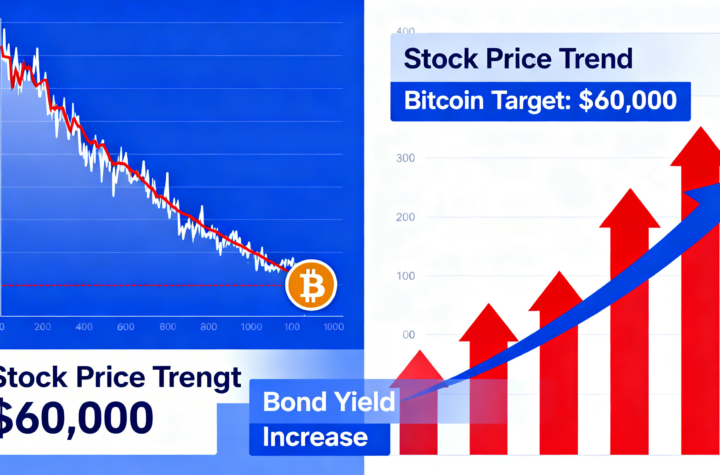
Equities catch up to bitcoin’s drop toward $60,000 amid a surge in bond yields.