

Bitcoin Holds Firm at 200-Day SMA, Hinting at a Potential Rebound
Technical patterns suggest BTC could be preparing for an upward move as selling pressure weakens.
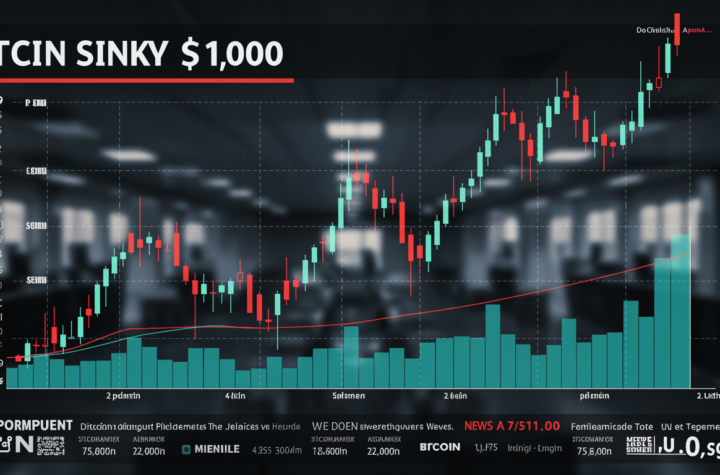
Market sentiment often manifests through candlestick formations, providing key insights into trader behavior. Since Friday, Bitcoin (BTC) has displayed signs of resilience at multi-month lows, with two notable candlestick patterns hinting at potential bullish momentum.
BTC’s price decline has found strong support at the 200-day simple moving average (SMA) since last Wednesday. Tuesday and Friday’s candles are particularly significant, featuring long lower wicks and small bodies—suggesting that while sellers briefly drove the price below this critical level, buyers quickly stepped in to regain control.
This price action is often viewed as a sign of seller exhaustion, which can precede a trend reversal. When a downtrend begins to lose momentum at a well-defined support level, traders typically anticipate a possible price recovery.
If BTC maintains its footing above the 200-day SMA, a bounce toward Sunday’s high of around $95,000 could be on the horizon. A sustained move beyond that level may fuel a rally toward the psychological $100,000 mark. However, if the 200-day SMA fails to hold, Bitcoin could face further downside pressure.

More Stories
Bitcoin drops under $71,000 while stocks end the day near session lows as expectations for a 2026 Fed rate cut dim further.
Fed pauses rate changes as the Iran conflict clouds the economic outlook and fuels inflation fears.
Cheap money is now behind us as ongoing conflict with Iran locks in a higher baseline for inflation.