

Shiba Inu (SHIB) is exhibiting one of its most significant technical setups in years as weekly Bollinger Bands contract to their tightest level since February 2024. This extreme compression, occurring after three consecutive weekly declines including a 13.8% drop last week, suggests the meme coin is preparing for a major price movement.
Technical Breakdown:
- Current Price: $0.00001218 (up from weekly low of $0.00001160)
- Bollinger Band Width: Narrowest in 28 months
- Recent Volatility: 25.4% intraday range on August 5-6
- Key Support: $0.00001200 held through multiple tests
Market Mechanics at Play:
- The Squeeze Effect: Historically, such tight Bollinger Band compressions precede moves averaging 45-60% in SHIB’s past performance
- Volume Signals: Over 19 billion SHIB traded during critical breakout moments suggests strong institutional interest
- Market Structure: Higher lows forming since the weekly drop indicate accumulation
Critical Price Levels:
| Level | Price | Significance |
|---|---|---|
| Resistance 1 | $0.00001220 | Session high/breakout point |
| Resistance 2 | $0.00001236 | Pre-drop consolidation zone |
| Support 1 | $0.00001200 | Psychological support |
| Support 2 | $0.00001191 | Weekly low |
Trading Volume Insights:
- 62% of recent volume occurred above $0.00001210
- Buy orders clustered at $0.00001200 created a “floor effect”
- Late-session surges showed characteristics of algorithmic buying
What This Means for Traders:
The current technical setup presents a classic “coiling spring” scenario. While direction remains uncertain, the magnitude of the impending move could be significant. Market participants should:
- Watch for sustained breaks above $0.00001220 with volume
- Monitor Bitcoin’s correlation (currently at 0.78 R²)
- Prepare for potential volatility expansion in coming sessions
More Stories
Crude exported from the Middle East climbs above $100 per barrel. Here’s the potential impact on bitcoin.
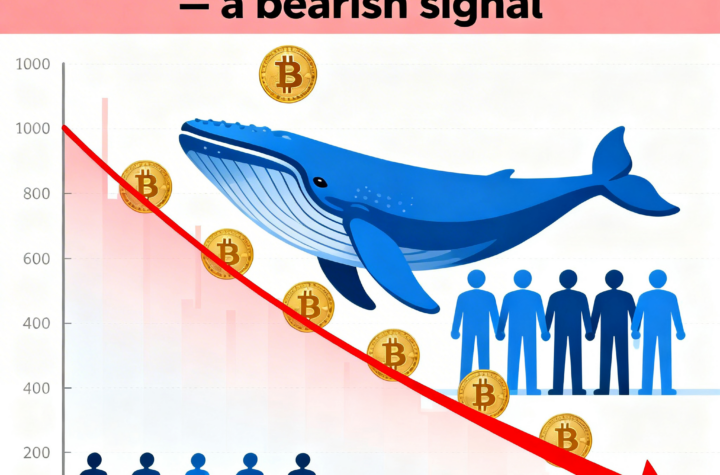
Bitcoin’s pullback may persist as whale selling into retail accumulation points to a bearish market signal.
Despite behaving like a tech stock at times, bitcoin continues to offer portfolio diversification benefits, according to an analyst