

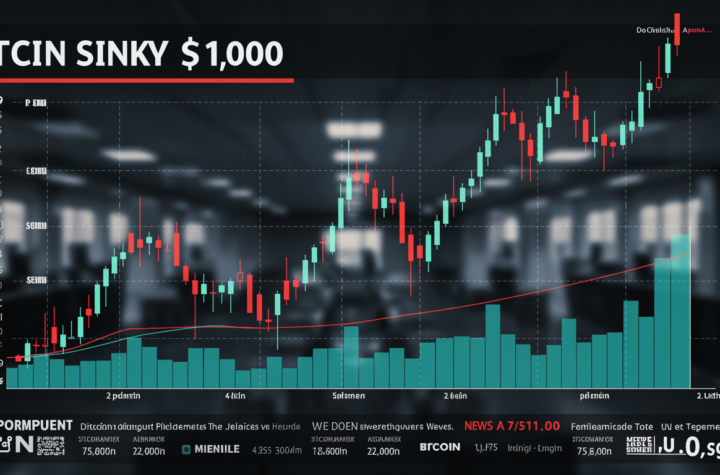
Historical data tied to Bitcoin’s 200-week simple moving average (SMA) suggests that the current price range between $90,000 and $110,000 will likely resolve positively, despite rising inflation concerns in the U.S. that may challenge the ongoing uptrend.
At the time of writing, Bitcoin’s 200-week SMA stands at $44,200, the highest it has ever been, according to TradingView. While this value remains well below the November 2021 peak of $69,000, it follows a trend seen in previous bull cycles: the 200-week SMA tends to rise toward the peak prices seen in the preceding bull run.
For example, in late 2021, the 200-week SMA rose to $19,000, mirroring the 2017 market high. Likewise, the 2017 bull market ended with the 200-week SMA reaching around $1,200, reflecting the all-time high set in 2013. If this historical pattern holds, Bitcoin’s current range is expected to break out bullishly, signaling further upward momentum.
Supporting this perspective, options data from Deribit shows that longer-term call options are more expensive than puts, suggesting that the market is pricing in an expectation of rising prices. In fact, the majority of open interest is concentrated in call options with strike prices above Bitcoin’s current market level of $96,700. The $120,000 call option has become the most popular, with over $1.8 billion in open interest, indicating widespread bullish sentiment in the market.
More Stories
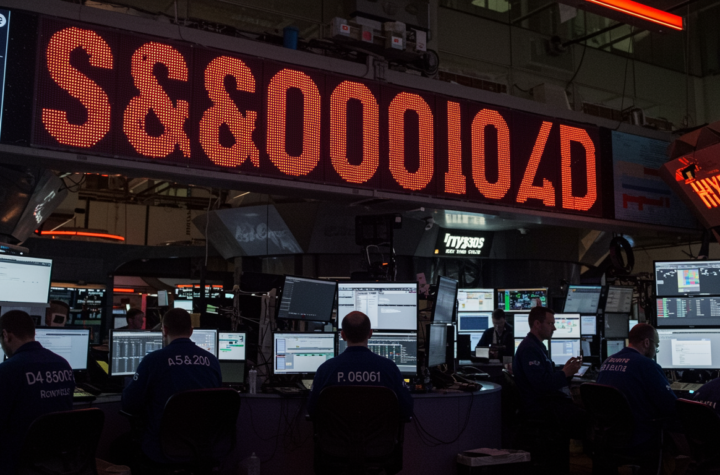
Bitcoin drops under $71,000 while stocks end the day near session lows as expectations for a 2026 Fed rate cut dim further.
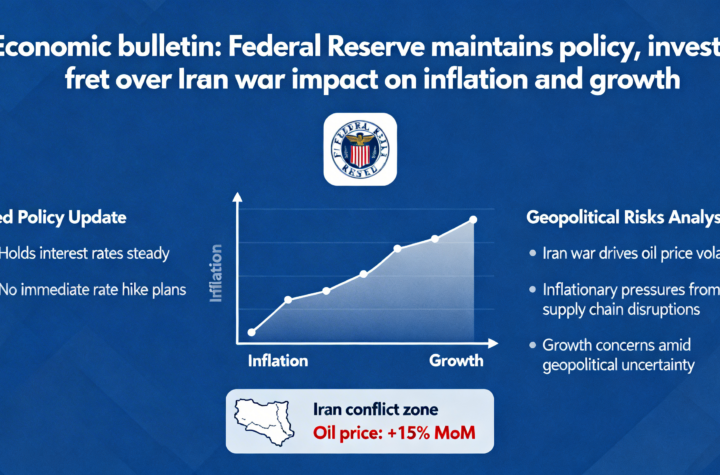
Fed pauses rate changes as the Iran conflict clouds the economic outlook and fuels inflation fears.
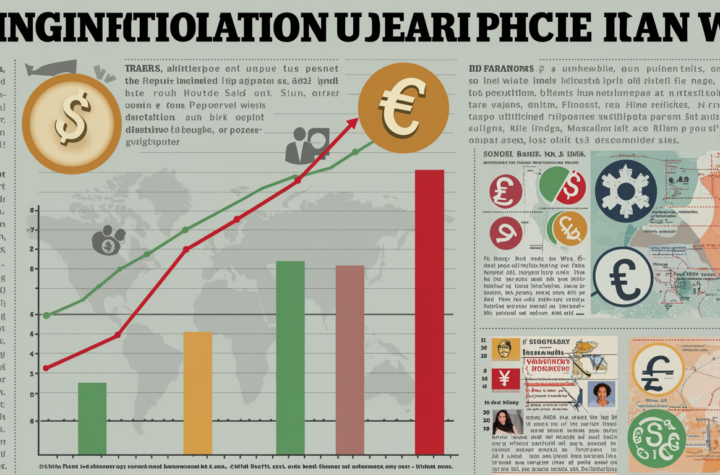
Cheap money is now behind us as ongoing conflict with Iran locks in a higher baseline for inflation.