

Bitcoin’s Head and Shoulders Pattern Suggests a Possible Drop to $75K: Analyst Warns
Bitcoin (BTC) has recently shown signs of a potential bearish reversal, with technical analysts closely watching its price action for the formation of a “head and shoulders” (H&S) pattern. If this pattern completes, it could result in a sharp decline, bringing BTC prices down to the $75,000 range.
After surging more than 50% since early November, bitcoin’s price has hit a point where it may be forming a typical H&S pattern, signaling a shift from a bullish to a bearish trend. The first shoulder was created during bitcoin’s failed attempt to break above the $100,000 resistance in late November.
The subsequent peak at over $108,000 in December formed the “head,” followed by a retracement to around $92,000. The more recent decline toward $97,000 appears to be forming the right shoulder of the pattern.
The key level to watch is the neckline, a horizontal line drawn through the lowest points of the two shoulders, currently sitting around $91,500. A breakdown below this neckline would confirm the pattern, setting the stage for a potential move down to $75,000, a target derived from the height of the head measured from the neckline.
Technical analysts often use patterns like these to predict future price movements. However, caution is essential since these patterns do not always play out as expected, and market conditions can change quickly, leading to false signals. As such, traders should be aware of the risk of a reversal if the pattern fails to fully develop.


More Stories
Nasdaq Pushes Market Data Onto Blockchain Rails in Distribution Expansion
Bitcoin’s Tight $59K–$60K Range Raises Risk of Sharp Breakdown
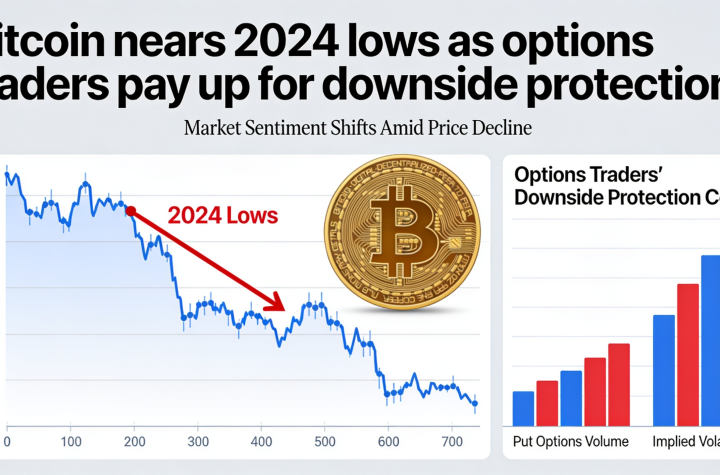
Bitcoin Slides Toward 2024 Lows as Traders Rush for Downside Hedges