

Bitcoin Eyes Major Resistance Zones Between $115K and $223K, Chart Analysis Shows
Bitcoin’s outlook remains firmly bullish, with prices consistently staying above $100,000 for nearly two months. As traders look ahead, analysts have identified key resistance levels ranging from $140,000 to beyond $200,000 that could challenge BTC’s next rally.
A widely used approach for spotting such resistance involves plotting trendlines—lines connecting significant peaks and troughs on price charts. These lines help visualize the market’s momentum and reveal potential areas where buying or selling pressure could intensify.
By connecting Bitcoin’s 2017 bull market high near $20,000 to its 2021 peak around $70,000 and extending that line forward, chart watchers have pinpointed a possible resistance zone at roughly $115,300, according to data from TradingView.
This same trendline acted as a significant barrier during December and January, leading to a market correction that saw BTC dip as low as $75,000 by April.
Log Charts Suggest Higher Resistance Around $223,000
The $115,300 resistance level comes from a linear (arithmetic) monthly price chart, which highlights absolute price changes and is often preferred for shorter-term technical analysis.
However, for long-term investors, resistance levels identified on logarithmic charts may carry greater weight. Log charts compress percentage-based moves, offering a clearer picture of exponential trends and often producing more reliable long-term projections.
On a log-scaled monthly chart that connects the 2017 and 2021 highs, the potential resistance shifts substantially higher, to around $223,000. Many analysts see this log-based level as more in line with Bitcoin’s historic pattern of exponential growth during previous bull runs.


More Stories
XRP Jumps 8% as Heavy Holder Losses Hint at Improved Entry Levels
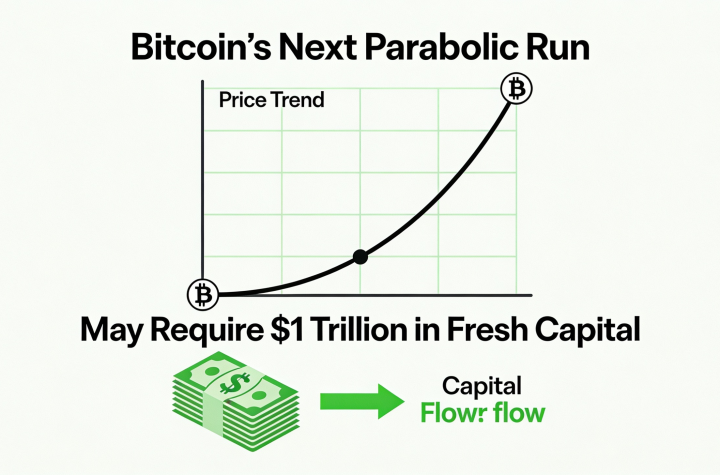
Bitcoin’s Next Breakout Could Require $1 Trillion in New Inflows
EU Targets Retail Access as Multibillion-Dollar Prediction Markets Surge