

MicroStrategy’s Chart Shows Potential Bullish Reversal with Double Bottom Pattern
On March 18, 2025, a bullish technical formation is emerging on the price chart of MicroStrategy (MSTR), signaling a potential reversal after a recent downtrend, in contrast to the bearish pattern seen in Bitcoin’s (BTC) price action.
The pattern in question is a double bottom, which occurs when a stock forms two consecutive troughs at roughly the same price level, indicating a possible end to the downward momentum. The pattern is confirmed when the price breaks through a trendline, known as the neckline, drawn between the peak of the two troughs. A breakout above this neckline typically signals a shift from a bearish to a bullish trend.
In the case of MicroStrategy, this pattern is significant because it follows a notable decline, with the gap between the troughs and the neckline being over 35%, which is well above the typical 10% seen in many double bottom formations. The double bottom has developed around $230 since late February, with resistance at $320.94 marked by a recovery in early March.
A breakout above the neckline would confirm the reversal and suggest that MSTR could enter a new bull market. Technical analysts often predict the upside potential by adding the distance between the troughs and the neckline to the breakout point, estimating that MSTR could rise to around $410.
Additionally, MicroStrategy has broken through the downtrend line that defined its price slide from the November high of $543, further supporting the possibility of a bullish trend reversal.
This developing double bottom on MSTR’s chart contrasts sharply with Bitcoin’s earlier double top pattern, which served as a warning of a price drop to $75,000. Bitcoin’s double top breakdown on February 24 led to a drop below $91,000, and the price continued to decline to $76,800 last week. A similar trend was observed in the Nasdaq index at the beginning of March.
Double bottoms and double tops are widely regarded as reliable technical patterns, with breakouts and breakdowns typically leading to extended price movements in the direction of the trend reversal.
As the largest publicly listed holder of Bitcoin, with 499,096 BTC worth approximately $41.5 billion, MicroStrategy’s price movements are keenly followed by investors, making its chart an important indicator for both stock and cryptocurrency market trends.


More Stories
JPMorgan Warns Strategy’s Bitcoin Selling Policy Introduces ‘Two-Way Risk’ to Crypto Markets
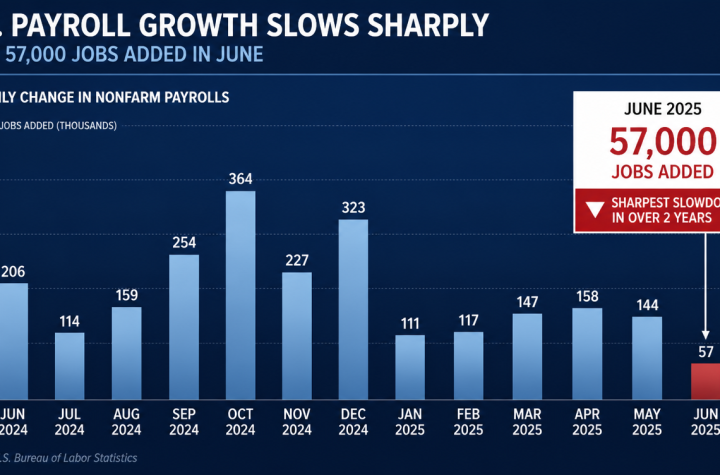
U.S. Job Growth Slows Sharply as June Payrolls Add Just 57,000 Positions
Nasdaq Firm That Mimicked Saylor’s Bitcoin Strategy Shifts Entirely From Crypto to AI