
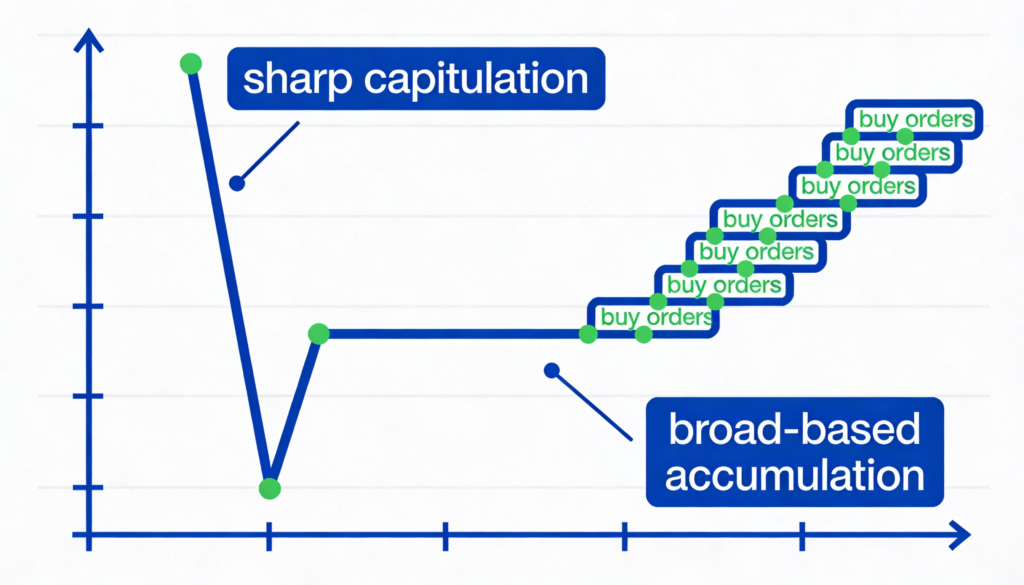
Bitcoin began February trading near $80,000, with large holders tentatively accumulating while retail investors exited the market. Within days, the price dropped sharply, falling to $60,000 on Feb. 5. Since then, on-chain indicators point to a broad shift back toward accumulation as investors across cohorts begin to see value at lower levels.
The move follows one of the deepest capitulation events in bitcoin’s history, which now appears to be giving way to a more coordinated accumulation phase.
This change is reflected in Glassnode’s Accumulation Trend Score by cohort, a metric that measures the relative strength of accumulation across wallet sizes by factoring in both entity size and the amount of bitcoin accumulated over the past 15 days. Scores closer to 1 indicate accumulation, while readings near 0 suggest distribution.
On a market-wide basis, the Accumulation Trend Score has risen above 0.5 to 0.68. This is the first instance of broad-based accumulation since late November, a period that previously coincided with bitcoin forming a local bottom near $80,000.
Wallets holding between 10 and 100 BTC have led the dip buying, particularly as prices approached the $60,000 level.
While it remains uncertain whether bitcoin has reached a definitive bottom, the data suggests investors are increasingly willing to accumulate after a drawdown of more than 50% from the October all-time high.


More Stories
Standard Chartered Sees Aave Rallying to $3,500 by 2030 on DeFi Resurgence
Bitcoin Holds Near $62,500 as Bearish Pressure Intensifies Across Crypto Markets
Runes Comeback: Bitcoin Activity Surges to Two-Year High as Transactions Top 820,000