

HBAR Declines 1.7% as Key Support Break Sparks Selling Pressure
Hedera’s HBAR token slid 1.7%, dropping from $0.1669 to $0.1697 following a failed breakout above $0.1716. The token traded within a $0.0089 range, showing 5.2% intraday swings, as buyers struggled to sustain momentum.
Initial support near $0.1633 briefly held, but the ascending trendline broke during a sharp afternoon selloff, signaling a weakening bullish structure. The decisive shift occurred around 13:00 UTC, when trading volume surged to 109.46 million tokens, 87% above the 24-hour average. A follow-up spike of 4.72 million tokens at 13:39 UTC confirmed the breakdown below $0.170, marking the start of sustained selling pressure.
Technical indicators suggest a distribution phase rather than a short-term dip. Repeated failed rebounds, declining highs, and high-volume breakdowns point to potential institutional selling, contrasting with typical retail-driven volatility. A brief trading halt from 14:14–14:17 UTC added further uncertainty, with post-halt trading likely to determine whether bearish momentum continues or stabilizes.
Technical Snapshot
Support & Resistance:
- Resistance: $0.1716, validated by heavy-volume rejection.
- Trendline Support: Broken at $0.170, indicating structural weakness.
- Base Support: $0.1633, from overnight session lows.
Volume Analysis:
- Peak volume 109.46M tokens, 87% above SMA, confirms distribution.
- Breakdown spike of 4.72M tokens validates technical failure.
- Volume tapering toward close suggests weakening buying interest.
Chart Patterns:
- Ascending channel failed after rejection above $0.171.
- Previous higher lows invalidated by trendline breach.
- Declining highs and failed rebounds signal distribution.
Targets & Risk/Reward:
- Immediate downside target: $0.1633 support.
- Maintain risk above $0.1716 resistance for short-term bearish positions.
- Observing trading patterns post-halt is crucial for gauging directional momentum.


More Stories
JPMorgan Warns Strategy’s Bitcoin Selling Policy Introduces ‘Two-Way Risk’ to Crypto Markets
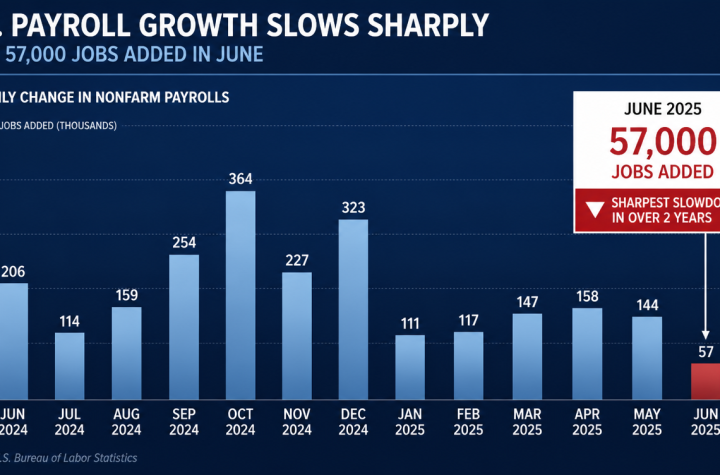
U.S. Job Growth Slows Sharply as June Payrolls Add Just 57,000 Positions
Nasdaq Firm That Mimicked Saylor’s Bitcoin Strategy Shifts Entirely From Crypto to AI