

Bitcoin consolidation deepens as key momentum signals flash warning
Bitcoin (BTC): Signs of exhaustion emerge near $120K
Bitcoin continues to trade sideways near $120,000, with Deribit options data pointing to notable positive dealer gamma at the $120,000 and $120,500 strikes. In such scenarios, dealers are inclined to buy on dips and sell into strength to maintain a neutral position—resulting in suppressed volatility and rangebound price action.
The critical support zone between $116,000 and $117,000—reinforced by both technical charts and on-chain data—remains a line in the sand. A breakdown below this area could trigger a retest of the May highs just under $112,000. On the flip side, a convincing breakout above $120,000 may open the door to fresh all-time highs.
Still, momentum indicators suggest that the bullish trend is running out of steam. A mere 0.12% uptick recorded on July 22 on the three-line break chart—a tool that filters out noise and only confirms directional changes when warranted—signals possible trend exhaustion.
AI’s Take: The faint 0.12% green bar on the three-line break chart is a key signal of weakening momentum. It reflects an overextended uptrend losing strength, increasing the risk of consolidation or reversal in the near term.
- Resistance: $120,000, $123,181
- Support: $116,000–$117,000, $114,700, $111,965
Ether (ETH): Momentum stalls near seven-month high
Ether surged nearly 2% over the past 24 hours, briefly hitting a seven-month peak of $3,937—invalidating last week’s indecisive Doji candle. However, the rally quickly faded, with prices retreating to $3,880 at the time of writing.
Technical indicators show diverging signals. The 14-day RSI failed to confirm the new high, suggesting potential bearish divergence. Meanwhile, the daily MACD histogram hints at a looming bearish crossover. These signals, coupled with weakening on-chain metrics such as Ethereum’s fee revenue, indicate that the rally may be on shaky ground.
The higher low at $3,510 established last Thursday remains a crucial support level. A drop below this mark could accelerate losses. To the upside, the $3,900–$4,100 zone—last seen in 2024—remains key resistance.
AI’s Take: A bearish MACD crossover and RSI divergence point to declining momentum. Ether’s price may be due for a near-term pullback unless bulls can reclaim $3,900 with conviction.
- Resistance: $4,000, $4,100, $4,382
- Support: $3,770 (daily low), $3,510, $3,000
XRP (XRP): Pullback underway after rejection at resistance
XRP has reversed earlier gains, retreating from the former support-turned-resistance at $3.35. The decline appears to have legs, with the hourly RSI breaking below its uptrend line and the MACD histogram dipping into negative territory—both signals of waning bullish momentum.
Price structure suggests a possible retest of the July 24 low at $2.96. A break below this level would shift the focus to the May high of $2.65. A broader bearish tone is also supported by a tweezer top pattern on the weekly chart, marked by back-to-back candles peaking at $3.65—an often-reliable signal of an impending reversal.
AI’s Take: The weekly tweezer top pattern and intraday bearish momentum signals point toward growing downside risks, potentially ending XRP’s multi-month rally.
- Resistance: $3.35, $3.65, $4.00
- Support: $2.96, $2.65, $2.44 (200-day SMA)
Solana (SOL): At resistance, but risks remain
Solana has bounced back above the hourly Ichimoku cloud and is forming higher lows, suggesting that bullish momentum may be building again. A retest of the upper bound of the ascending channel near $200 appears plausible.
However, caution is warranted. The daily chart still reflects a tweezer top formation near $205–$206, a classic bearish reversal pattern. A breakdown below $184—its most recent higher low—could set off a deeper correction toward the 200-day SMA at $163.
AI’s Take: While Solana has shown signs of recovery, the tweezer top pattern indicates potential exhaustion. A break below $184 would confirm the bearish reversal and could lead to a steeper decline.
- Resistance: $205–$206, $218, $252
- Support: $184, $163, $126


More Stories
XRP Jumps 8% as Heavy Holder Losses Hint at Improved Entry Levels
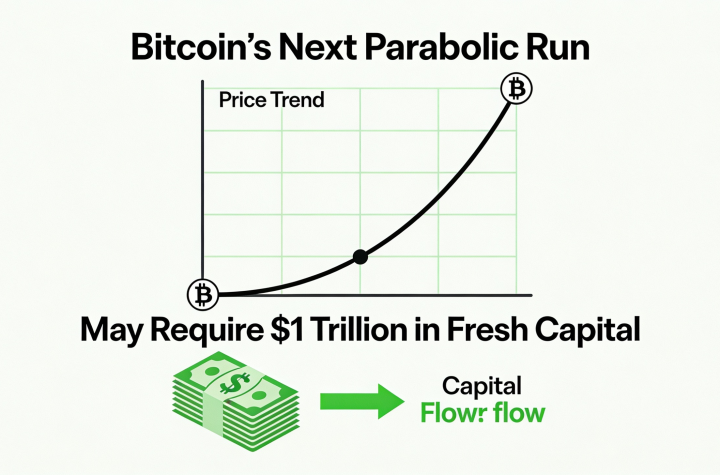
Bitcoin’s Next Breakout Could Require $1 Trillion in New Inflows
EU Targets Retail Access as Multibillion-Dollar Prediction Markets Surge